
Reading a Meme Coin Chart: A Trader's Guide
Master the meme coin chart with this guide. Learn to read on-chain signals, analyze whale movements, and find high-potential trades before they trend.
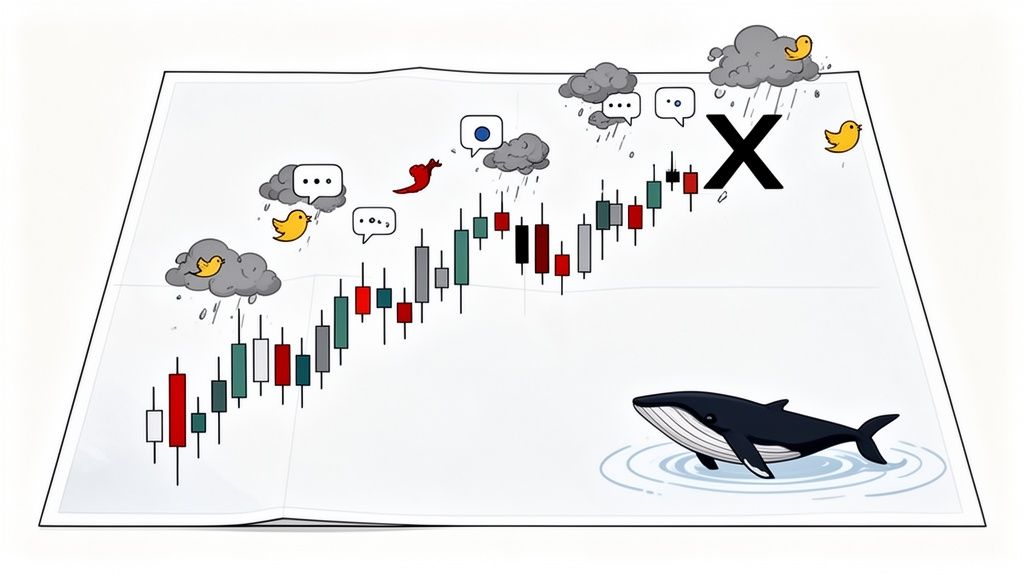
A meme coin chart is a real-time map of a token's price, volume, and on-chain data. But it runs on a different engine than traditional stock charts. Forget fundamentals; think of it as a live feed of internet hype, where community mood swings and massive "whale" buys dictate price direction.
Quick Start: Read Any Meme Coin Chart in 60 Seconds
Before you dive deep into analysis, here's your 60-second chart reading framework. This quick scan tells you instantly whether a meme coin deserves deeper research or should be avoided entirely.
Step 1: Check the timeframe (5 seconds)Set your chart to the 1-hour view. This captures the sweet spot between too much noise (5-minute charts) and too slow (daily charts). Meme coins move fast—hourly charts show you what's happening right now.
Step 2: Read the last 24 hours of candles (10 seconds)Look at the most recent 24 candles. Are they mostly green (buying pressure) or red (selling pressure)? One long green candle isn't enough—you want to see sustained green momentum over 6-12 hours minimum.
Step 3: Verify volume matches price (10 seconds)Scroll down to the volume bars below the price chart. When price pumps, volume bars should be 2-3x taller than normal. If you see a 50% price pump on tiny volume, that's manipulation or a fake-out. Walk away.
Step 4: Check market cap instantly (10 seconds)Look at the top of your chart interface where market cap is displayed. Under $1M = extremely high risk but 100x potential. $1M-$10M = moderate risk, 10-50x potential. Over $100M = lower risk but likely only 2-5x from here.
Step 5: Scan liquidity pool size (10 seconds)Find the LP (liquidity pool) metric, usually shown on DEX screeners like DexScreener or DEXTools. Under $50K liquidity = don't touch it (you can't sell). $50K-$500K = tradeable but risky. Over $500K = safe enough to trade without massive slippage.
Step 6: Count holder wallets (15 seconds)Check the holder count on the token's page. Under 100 holders = too early and risky. 100-1,000 holders = early but growing. 1,000-10,000 holders = established community. Over 10,000 = probably past its major run.
Total time: 60 seconds. Decision: Go deeper or move to the next coin.
Why Meme Coin Charts Behave Differently
Start tracking smart money today
Join thousands of traders using WalletFinder.ai to find profitable wallets and copy their trades.
Start Free Trial →

