
Leash Coin Price: A Trader's Guide to LEASH
Explore the Leash coin price with our complete guide. Understand its history, key drivers, risks, and how to track smart money for LEASH trades.
The leash coin price doesn’t just move fast. It breaks the assumptions most traders bring to a chart.
One data point reframes the whole asset: LEASH fell from $266.00 at the start of 2025 to $0.0165 by year-end, a 1,609,481% decline according to CoinLore historical data. When an asset can print a move like that after a prior year that was positive, standard chart reading stops being enough.
That’s the core problem with LEASH. A clean candle setup can mean very little if the order book is thin, the quoted price differs wildly between venues, and a handful of wallets can move the market merely by showing up. Traders who treat LEASH like a liquid large-cap usually learn the hard way. Traders who treat it like an on-chain microstructure puzzle have a better chance.
Decoding the LEASH Coin Price Puzzle
Most traders look at three things first: price, chart, and market cap. With LEASH, that stack can mislead you.
The quoted leash coin price is often less a single truth and more a rough snapshot from a fragmented market. If you only watch one exchange ticker or one aggregator, you can end up trading a headline number instead of tradable reality. That’s a bad setup in any market. In LEASH, it’s dangerous.
A better starting point is to think in layers:
- Surface layer: the current quoted price
- Structure layer: supply, liquidity, and holder concentration
- Behavior layer: what active wallets are doing on-chain
That last layer matters most. In very thin markets, the wallets often tell the story before the chart does. A chart shows what printed. Wallet flows show who acted, when they acted, and whether a move came from broad participation or just a few addresses shifting inventory.
Practical rule: If an asset is hard to price consistently across venues, don't trust the chart alone. Verify the underlying activity.
LEASH also punishes lazy position sizing. Traders often assume they can “test” a setup with a small order and scale later. In low-liquidity tokens, scaling later can be the hardest part. Entry, exit, and even price validation all become execution problems.
If you want a framework for thinking about token valuation before you even touch the trade, this guide on how to calculate coin value is a useful companion to the LEASH puzzle.
What Is Doge Killer LEASH Anyway
LEASH sits inside the Shiba Inu ecosystem, but traders who treat it like another meme token usually misread it. The setup is different. Supply is tight, liquidity is uneven, and a few active wallets can shift the market faster than any clean chart pattern suggests.

Why LEASH behaves differently
LEASH was built to be scarce, and that scarcity changes how price forms. In high-liquidity majors, chart structure often reflects broad participation. In LEASH, one wallet rotating size, one LP shift, or one cluster of buys across fragmented venues can distort the tape.
That creates a practical problem for traders. Candles may look decisive while the underlying move is thin, isolated, or driven by inventory transfers rather than fresh conviction. Standard support and resistance levels still matter, but they carry less weight when market depth is shallow.
A better read comes from combining market structure with wallet behavior. Traders who rely only on a meme coin chart setup can end up reacting to prints that were never broadly validated on-chain.
Scarcity is the feature and the risk
Scarcity can support higher per-token pricing, but it also makes execution worse. Spreads can widen fast. Slippage can turn a decent entry into a poor one. Exits are often harder than entries, especially when momentum stalls and bids thin out.
That is why LEASH trades more like a specialist on-chain asset than a retail momentum coin.
The edge usually comes from identifying who is accumulating before the chart looks obvious. In practice, that means tracking wallet clusters, watching transfers into liquidity venues, and separating real positioning from noise. With LEASH, fragmented liquidity makes pure chart analysis incomplete. On-chain wallet tracking gives a cleaner view of whether stronger hands are building, distributing, or rotating exposure.
If you approach LEASH with a standard altcoin playbook, you will miss what actually moves it.
The Wild Ride of the LEASH Price History
LEASH has traded from near five figures to fractions of a dollar. That range is the first clue that its history is less useful as a clean chart and more useful as a stress test for how this market functions.
The headline extremes matter because they keep pulling traders back in. A prior peak creates reflexive upside targets, while a brutal collapse creates the illusion that every bounce is a bargain. In LEASH, both instincts can be expensive if they are based only on candles.
From premium pricing to unstable repricing
Early LEASH price action built the core narrative fast. Limited supply, strong ecosystem attention, and speculative demand pushed traders to treat it like a scarce asset that could command premium valuations. That framing still shapes positioning today. Traders see the old range and assume the token can revisit it if sentiment returns.
The problem is that historical pricing in LEASH says very little about current executable demand. In a market this thin, a sharp move can reflect a short burst of aggressive buying, a rotation by a small cluster of wallets, or weak order books across fragmented venues. Traditional pattern traders often read those moves as broad confirmation when they are really reacting to a narrow flow event.
That distinction matters.
The collapse changed how serious traders should read the chart
LEASH later moved from a constructive period into a severe breakdown. The lesson was straightforward. Prior strength did not create reliable support, and scarcity did not stop repricing once liquidity thinned and conviction disappeared.
For active traders, standard chart interpretation begins to falter. A breakout on LEASH can look clean and still have weak follow-through because the move was never widely sponsored. A support retest can fail even after a strong bounce because a few wallets are distributing into thin bids. The chart records the result. It does not always reveal who caused it or whether that flow is still active.
That is why LEASH price history should be used carefully. It helps identify where traders are likely to anchor, where old bag holders may look to exit, and where momentum buyers may overreact. It does not, by itself, explain whether stronger hands are accumulating again.
A practical read of LEASH history leads to three trading rules:
- Old highs are reference points, not targets. They show where speculation once peaked, not where fair value sits today.
- Violent drawdowns reset market structure. After a collapse, prior support zones often lose relevance because the wallet base and available liquidity have changed.
- Confirmation needs on-chain context. In LEASH, wallet flows often matter more than a textbook setup on the chart.
Traders who want better signal should treat chart history as a map of crowd psychology, then verify it with wallet activity. A setup that looks attractive on a meme coin chart pattern becomes far more credible when the same period shows accumulation by wallets that have historically entered before major repricings.
That shift in process is where the edge is. In LEASH, the tape is often too thin and too fragmented to trust on its own. Wallet tracking through tools like Wallet Finder.ai gives a better chance of spotting real positioning before the move looks obvious on the chart.
Fundamental Drivers Behind LEASH Price Swings
LEASH doesn’t swing because it’s “just volatile.” It swings because its market structure is fragile.
The most useful way to read LEASH is to stop asking whether the chart looks bullish or bearish and start asking whether the market can absorb real buying or selling without breaking. In LEASH, that answer is often no.
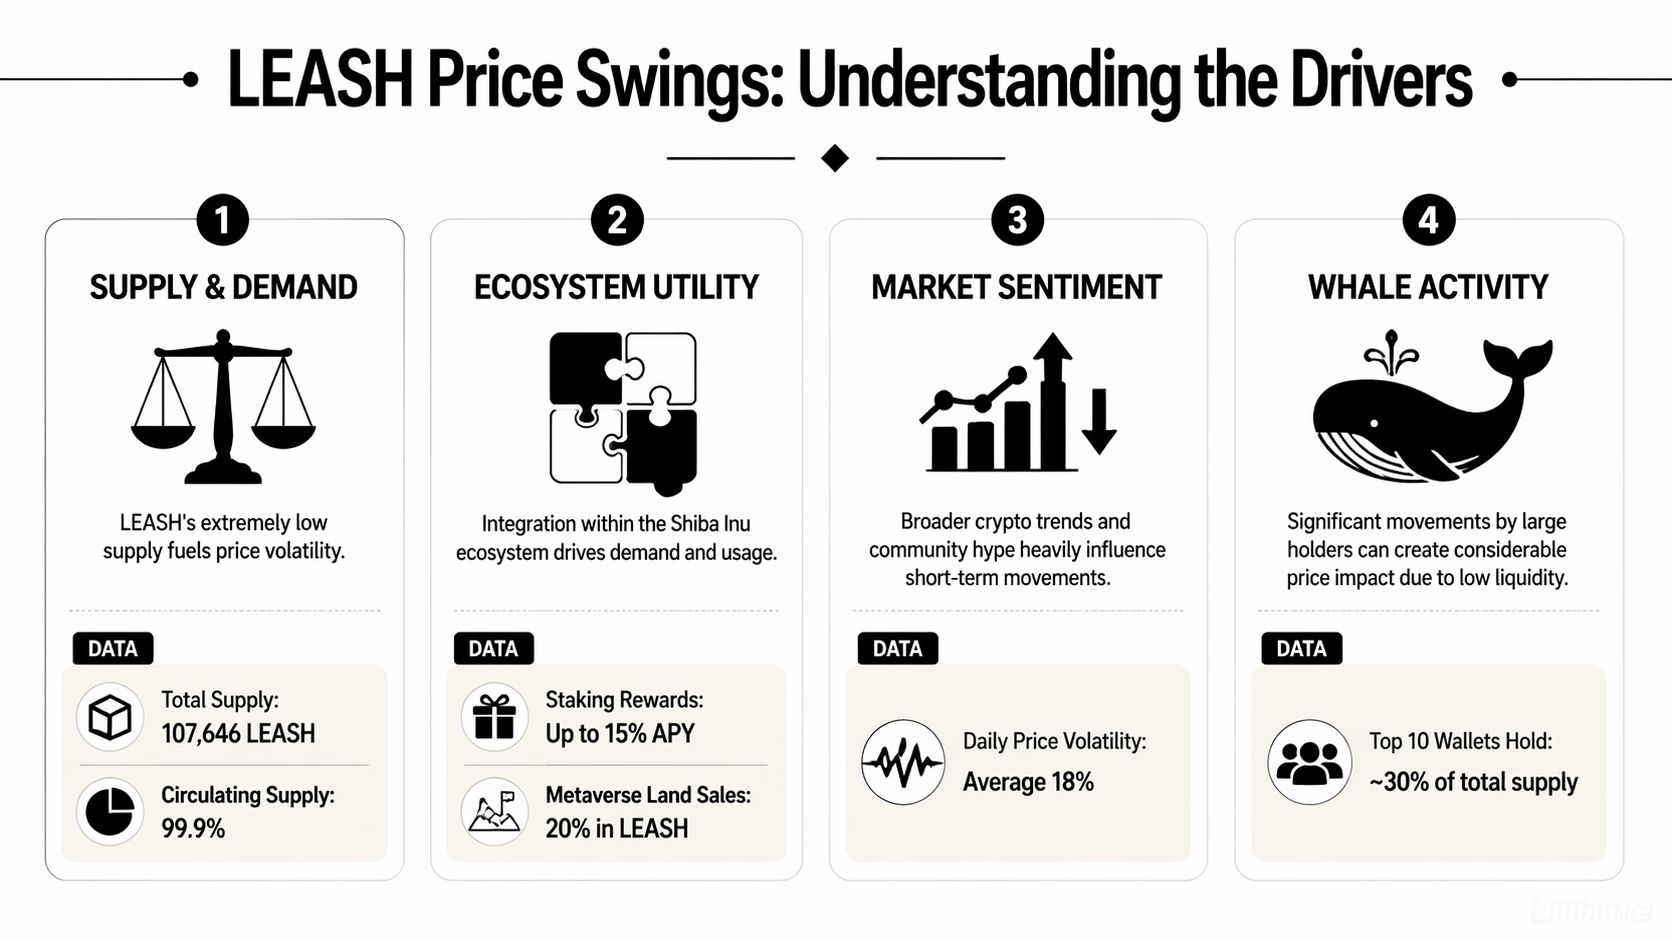
The mechanics that matter
CoinMarketCap’s LEASH listing identifies the core setup clearly. LEASH has a total supply of 107,646 tokens. Its market is also highly illiquid, with 24-hour trading volume often below $10,000 and a volume-to-market-cap ratio frequently under 0.5%.
For traders, those aren’t background stats. They are the market.
| Metric | Value | Implication for Traders |
|---|---|---|
| Total supply | 107,646 tokens | Scarcity magnifies price impact from relatively small flows |
| 24-hour trading volume | Often below $10,000 | Even modest orders can face weak depth and poor fills |
| Volume-to-market-cap ratio | Frequently under 0.5% | Daily liquidity is thin relative to headline valuation |
Start tracking smart money today
Join thousands of traders using WalletFinder.ai to find profitable wallets and copy their trades.
Start Free Trial →

