
Market Structure Diagram: A Trader's Guide for 2026
Learn to read and draw a market structure diagram for trading. This guide explains trends, liquidity, and orderflow for DeFi and on-chain analysis.
You open a chart, draw two lines, and five minutes later the setup is gone. Price wicks above a high, dumps into your stop, then rips in the original direction. If that feels familiar, you're not bad at trading. You're probably reading motion without reading structure.
That's where a market structure diagram helps. In economics, it's a way to classify industries by competition and market power. On a trading chart, it's a way to organize price swings so you can tell whether buyers or sellers are in control. Both meanings matter. One explains the environment an asset lives in. The other helps you decide whether to enter, wait, or get out.
Most traders only need the second meaning day to day. But if you skip the first one entirely, you miss why some markets trend cleanly, why some chop, and why some assets behave like they have gravity around key levels. The useful path is to learn the textbook version first, then translate it into chart logic you can use on-chain.
Reading the Market Without Getting Lost
A new trader often sees the same chart in three different ways within one hour. First it looks bullish. Then a red candle makes it look bearish. Then a bounce makes it look like a breakout again. That kind of flip-flopping usually comes from watching candles one by one instead of reading the sequence they create.
Think about a volatile token after a launch. Price pushes up fast, pulls back hard, reclaims the prior high, then sweeps below a local low before moving higher again. If you're focused on single candles, that chart looks random. If you're focused on structure, it starts to read like a story. You can ask better questions. Is price making higher highs and higher lows? Did it break a meaningful swing? Was that move expansion or just noise?
Markets become easier to read when you stop asking what the last candle means and start asking what the last sequence means.
That's the trading use of market structure. It acts like grammar for price action. Instead of treating every move as a fresh mystery, you start grouping moves into trends, pullbacks, breaks, and reversals.
There's another reason this matters in DeFi. Crypto traders borrow language from several worlds at once. An economist says “market structure” and means competition between firms. A chart trader says “market structure” and means highs, lows, and trend shifts. If you mix those up, the advice sounds contradictory when it really isn't.
Here's the clean way to approach it:
- Economic market structure helps you understand the broader competitive environment around a market or protocol.
- Trading market structure helps you map what price is doing right now.
- A market structure diagram becomes useful when it turns abstract movement into a repeatable framework you can mark on a chart.
Understanding Market Structure The Textbook View
In economics, a market structure diagram is a map of how a market is organized. The textbook version usually starts with three questions. How many sellers are active? How easy is entry or exit? How similar or differentiated are the products? Those questions sit behind the standard four market types summarized in Wikipedia's overview of market structure.
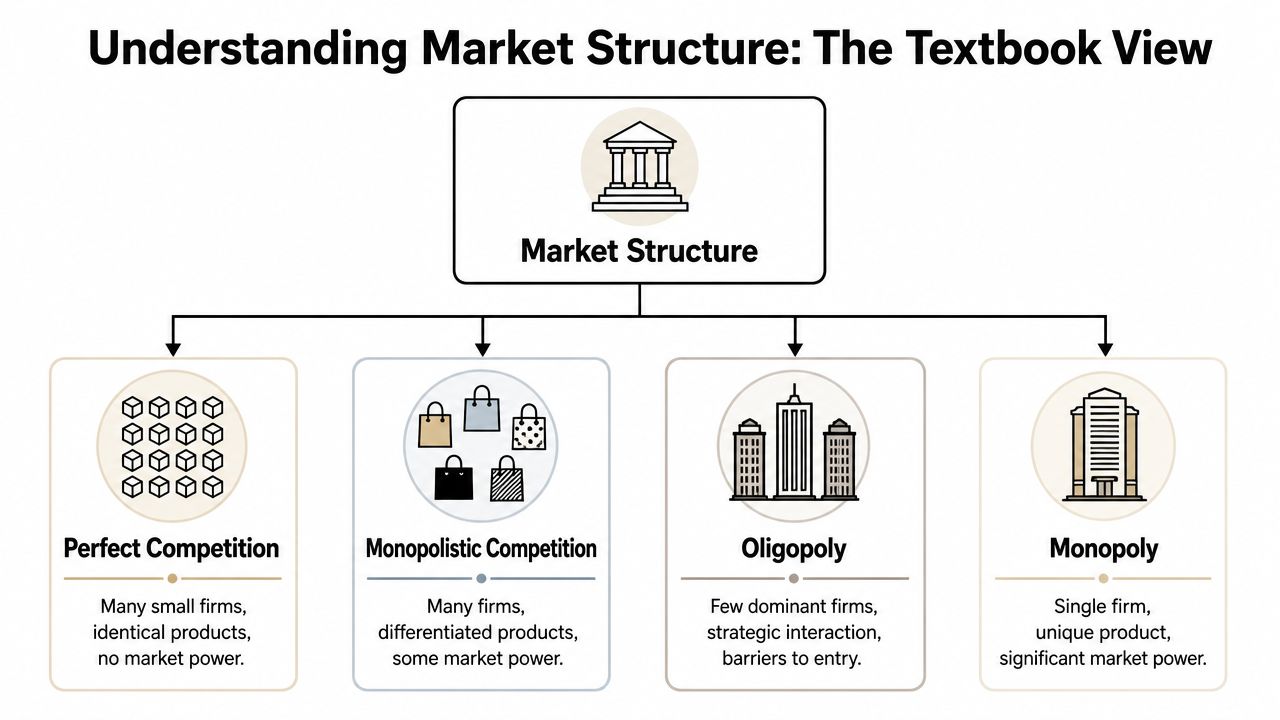
That is the classroom definition.
For traders, the value of that definition is not the labels themselves. The value is that it teaches you to ask who has power, where that power comes from, and how hard it is for new competitors to change the balance. On a chart, those questions later turn into a different kind of structure reading.
The four textbook structures
A simple way to read the four categories is as a spectrum of pricing power.
| Structure | Core traits | Practical intuition |
|---|---|---|
| Perfect competition | Many small firms, homogeneous products, low barriers to entry and exit | No single seller has meaningful control over price |
| Monopolistic competition | Many firms, but products are differentiated | Firms can influence demand for their own version of the product |
| Oligopoly | A small number of large firms dominate | A few players can shape the market and must react to each other |
| Monopoly | One firm, no close substitutes, blocked entry | One seller holds substantial market power |
Start tracking smart money today
Join thousands of traders using WalletFinder.ai to find profitable wallets and copy their trades.
Start Free Trial →

