
Long Short Ratio: Master Crypto Sentiment in 2026
Master the long short ratio to decode crypto sentiment. Learn to interpret this key metric, avoid traps, & make smarter trading decisions in 2026.
You’re probably in the same spot most developing derivatives traders hit sooner or later. Price is moving, funding looks noisy, the chart has already run farther than feels comfortable, and your main question isn’t “what is Bitcoin doing?” It’s “who’s trapped here, and on which side?”
That’s the primary role of a good sentiment indicator. Price shows the result. Positioning shows the vulnerability behind the move.
The long short ratio is one of the fastest ways to read that vulnerability. Used badly, it turns into a lazy bullish-or-bearish label. Used well, it helps you spot crowded trades, likely liquidation paths, and the moments when following the crowd is the worst trade on the screen.
Decoding Sentiment in a Volatile Market
A lot of traders stare at candles as if price alone will confess what comes next. It won’t. A sharp rally can mean real conviction, or it can mean late longs chasing momentum just before a flush. A fast drop can mean trend continuation, or it can mean shorts piling in right before a squeeze.
That’s where sentiment data matters. The long short ratio gives you a quick read on how futures traders are positioned, which is often more useful than another indicator layered on top of price. It doesn’t tell you where the market must go. It tells you how one-sided the market has become.
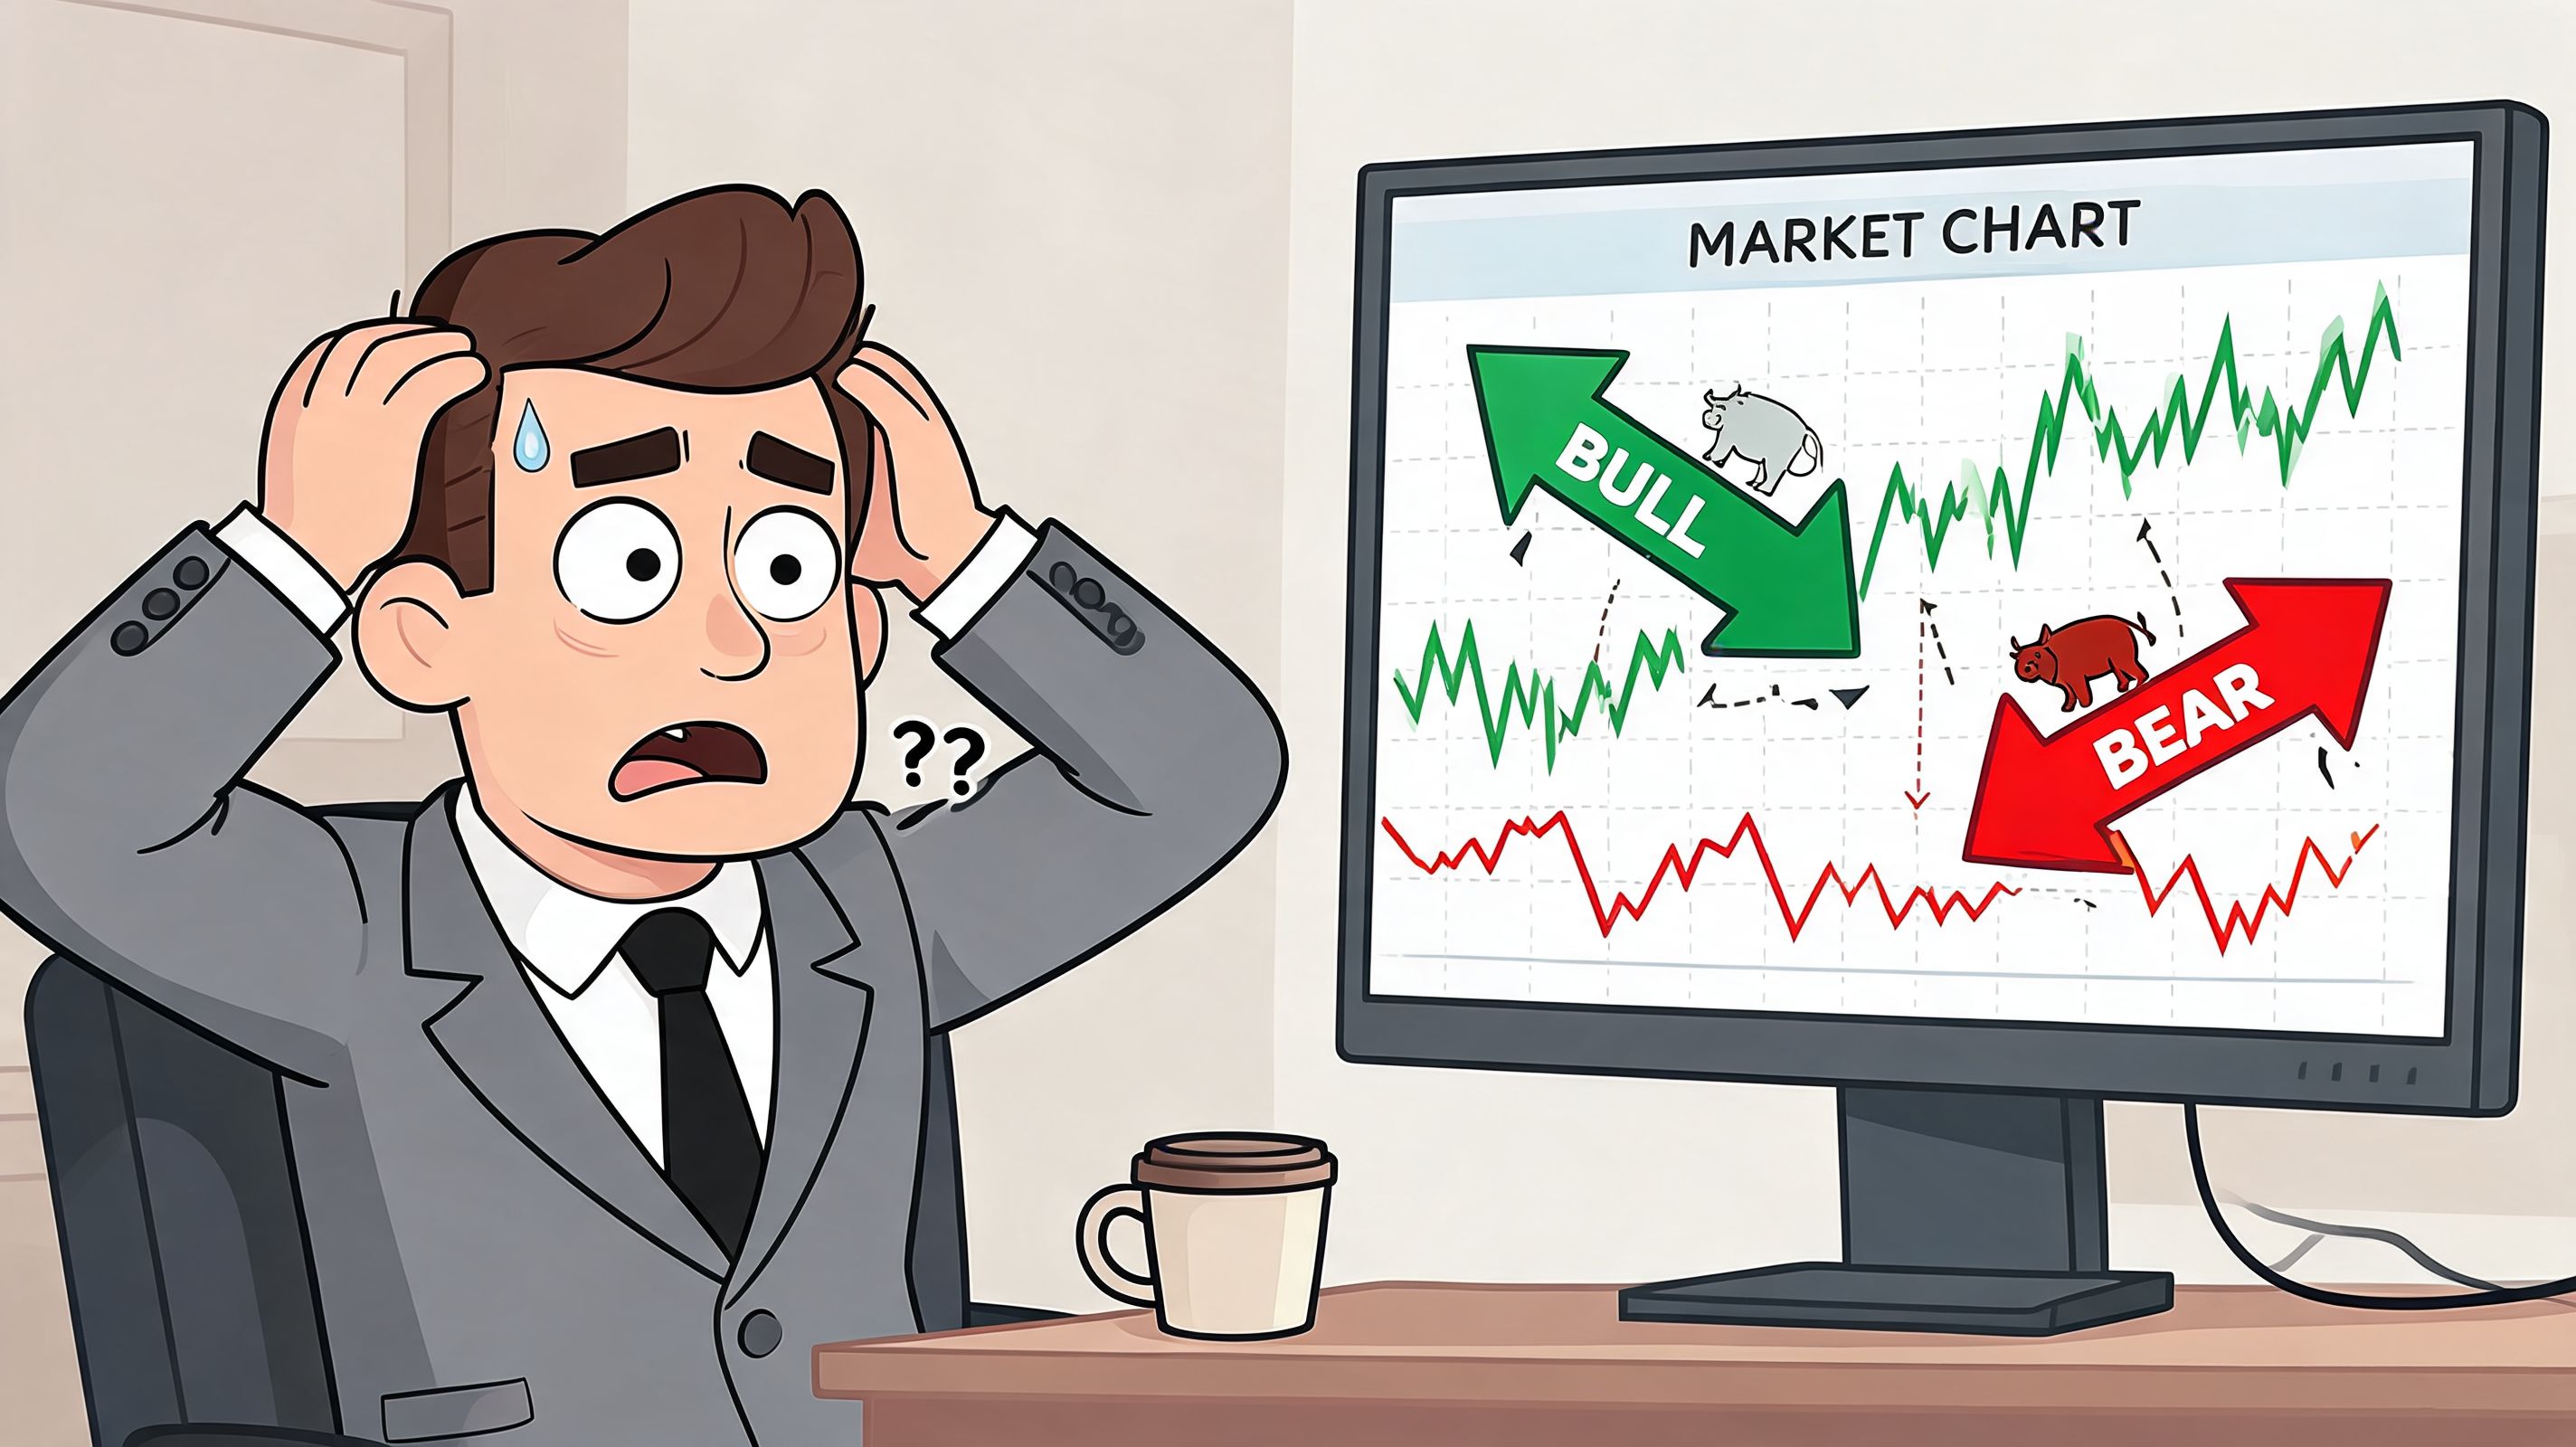
If you already track narratives, social chatter, and broad risk appetite, adding a proper crypto market sentiment analysis framework gives that process structure. The long short ratio fits into that framework as one of the clearest public signals of crowd positioning in derivatives.
Why traders misread the tape
Most bad reads come from one mistake. Traders assume that if many participants are long, the market is strong. Sometimes that’s true early in a trend. It often stops being true when everyone who wants to buy has already bought.
In practice, the ratio is less useful as a cheerleader and more useful as a stress test. If positioning leans too hard in one direction, the next move often comes from forced exits, not fresh conviction.
Practical rule: Don’t ask whether the crowd is bullish. Ask whether the crowd is already too bullish to keep paying up.
What you’re actually trying to detect
The goal isn’t to predict every swing. It’s to identify conditions where risk and reward stop being symmetrical.
A useful read on the long short ratio helps you answer three trader-grade questions:
Is the move supported or crowded
A rising market with balanced positioning behaves very differently from a rising market packed with late longs.Where is the liquidation fuel
Crowded longs create downside fuel. Crowded shorts create upside fuel.Should you trade with momentum or fade it
This is the big one. The ratio often tells you when trend-following still works and when contrarian thinking becomes the higher-quality trade.
What Is the Long Short Ratio Explained
The long short ratio measures the balance between bulls and bears in the futures market. It shows whether more accounts are positioned for upside or downside, which makes it one of the fastest public reads on crowd sentiment.

The basic formula
The formula is simple. Divide total long positions by total short positions.
A reading above 1.0 means more accounts are long than short. A reading below 1.0 means short exposure dominates by account count. Traders use it as a sentiment gauge because it answers a practical question fast. Which side of the derivatives crowd is getting crowded?
Amberdata’s long short ratio reference also shows why the metric is easy to use in practice. It is published as a straightforward ratio, and exchange datasets can provide frequent updates that make it useful for active futures trading.
Where the data comes from
The ratio usually comes from major derivatives exchanges and is tied to positioning data around open interest. For intraday traders, that matters. A slow sentiment indicator has limited value when perp markets can reprice hard in a few minutes.
Fast updates let you track whether traders are chasing a breakout, fading a move, or getting trapped on one side. Used well, the ratio gives context to price instead of replacing it.
That distinction matters.
The detail most beginners miss
The standard long short ratio usually reflects accounts, not position size or capital committed. A market can show more long accounts while larger players are still carrying the other side with more size.
That is why experienced traders treat the ratio as a crowd-positioning signal first. It is less reliable as a pure money-flow signal unless you pair it with other derivatives data such as crypto funding rate behavior in perpetual futures.
This is also where the contrarian edge starts to show. A high ratio does not mean a market is strong. It can mean the easy longs are already in, late buyers are paying up, and downside liquidation fuel is building. The same logic applies in reverse when the ratio gets heavily skewed to shorts.
Why it matters in real trading
Used on its own, the long short ratio tells you where the public is leaning. Used well, it helps you spot when that lean becomes vulnerable.
I pay more attention when the reading reaches an extreme and wallet activity from larger participants does not confirm the crowd. Public positioning can point one way while private wallet-tracking signals from Wallet Finder.ai show smart money reducing risk, distributing into strength, or absorbing panic selling. That mismatch is often more useful than the raw ratio itself.
Keep the base read simple:
- Above 1.0 means the crowd leans bullish.
- Below 1.0 means the crowd leans bearish.
- Fast changes show sentiment is shifting quickly.
- Extreme readings matter more than routine ones.
The ratio is not powerful because it defines sentiment. It is powerful because crowded sentiment creates tradeable weakness.
How to Interpret Long Short Ratio Signals
Most traders overcomplicate this. You don’t need a dozen labels. You need a practical interpretation framework that separates normal positioning from dangerous crowding.
The cleanest first cut is simple. A ratio around 1.0 is balance. Above it, longs dominate. Below it, shorts dominate. According to JR Kripto’s explanation of long short ratio behavior, a ratio of 2.0 from 80 long positions divided by 40 short positions means twice as many accounts are long, and very high readings such as 70% long positions can signal overextension rather than healthy strength.
A trader’s quick read
Here’s the framework I’d keep next to the chart.
| Ratio Value | Market Sentiment | Potential Implication |
|---|---|---|
| Below 1.0 | Bearish bias | More accounts are short than long. Watch for continuation if price confirms, but stay alert for squeeze conditions if positioning gets one-sided. |
| Near 1.0 | Balanced | Neither side is clearly dominant. Momentum signals from price and liquidity matter more here. |
| Above 1.0 | Bullish bias | More accounts are long than short. Trend continuation is possible if other metrics stay healthy. |
| Far above 1.0 | Crowded bullish positioning | Upside can become fragile. A pullback can trigger long liquidations and a sharper-than-expected reversal. |
| Far below 1.0 | Crowded bearish positioning | Downside can become fragile. A bounce can force shorts to cover and fuel a squeeze. |
Start tracking smart money today
Join thousands of traders using WalletFinder.ai to find profitable wallets and copy their trades.
Start Free Trial →

