
Crypto Market Trend Indicators: Master Signals for 2026
Master crypto market trend indicators. Learn traditional vs. on-chain signals, how to combine them, and use tools like Wallet Finder.ai for smart decisions in
You're probably looking at a chart that seems obvious for a moment, then completely ambiguous a few candles later. Price pushes up, RSI looks stretched, MACD starts to turn, and a few large wallets begin moving size on-chain. The problem isn't a lack of signals. It's figuring out which ones describe a real trend and which ones are just noise dressed up as conviction.
That's where market trend indicators help, but only if you use them for their intended strengths. In crypto, a clean edge rarely comes from one line on a chart. It comes from combining traditional technical indicators, which summarize price behavior, with on-chain indicators, which show what market participants are doing with capital in real time.
What Are Market Trend Indicators
A trend can look clean until the next few candles print. Bitcoin grinds higher, altcoins lag, funding starts to heat up, and one wallet cluster begins sending size to exchanges. In that moment, a single chart indicator is usually too narrow. Market trend indicators matter because they help separate a durable move from a move that only looks strong on the surface.
At a basic level, market trend indicators are tools for organizing market behavior into something tradable. They help answer a narrower and more useful question than “where does price go next?” The better question is whether the current move has direction, strength, participation, and enough follow-through to justify risk.
Two families of signals
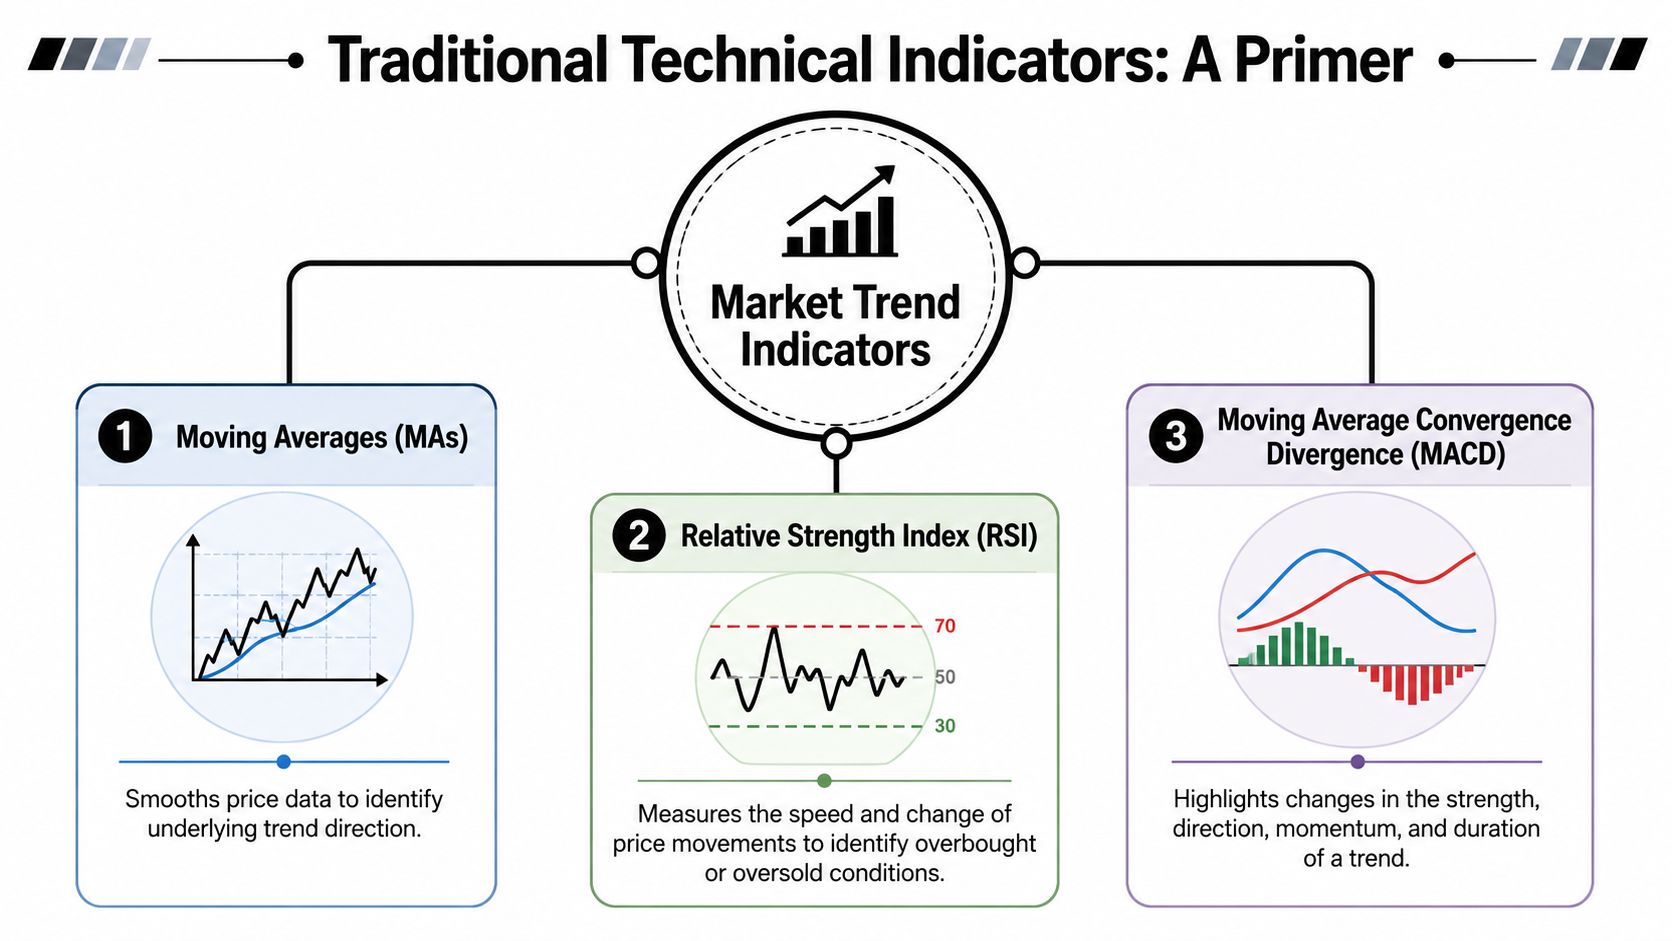
The first family is traditional technical indicators. These are built from price and volume on the chart. Moving averages smooth trend direction. RSI tracks the pace of recent moves. MACD compares short-term and medium-term momentum. ADX measures whether a market is trending with enough force to matter. If you want a more detailed breakdown of speed and exhaustion signals, this guide to momentum indicators in crypto trading covers that layer well.
The second family is on-chain indicators. These start with blockchain activity instead of candle structure. They track wallet accumulation, exchange inflows and outflows, holder behavior, realized profit-taking, and capital rotation across assets. In crypto, that changes the job of trend analysis. Traders are no longer limited to reading the result of positioning. They can also inspect parts of the positioning itself.
Practical rule: Chart indicators show how the move looks. On-chain indicators help show who is behind it, and whether that participation is expanding or fading.
What trend indicators are actually good for
Used correctly, trend indicators help traders judge four things:
- Direction: Is the market still printing behavior consistent with an uptrend or downtrend?
- Strength: Is the move gaining force, or just drifting on low conviction?
- Participation: Is demand broad enough to trust, or concentrated in a few actors?
- Regime: Is this a market for trend-following setups, or a choppy market that punishes them?
That last point gets overlooked. Traders often blame an indicator when the underlying problem is regime mismatch. A moving average crossover can work well in expansion and fail repeatedly in sideways conditions. On-chain signals have the same limitation. Wallet accumulation can appear constructive for days while price stays range-bound because macro pressure or derivatives positioning keeps capping the move.
The edge comes from combining both sets of information. Traditional indicators are usually lagging. They confirm that a move is already visible in price. On-chain indicators can be earlier, but they are noisier and easier to misread without context. A useful framework is simple: use chart-based indicators to confirm structure, then use on-chain activity to test whether the trend has real sponsorship behind it.
That is the standard I use. The question is rarely “Which indicator is best?” It is “Which mix of lagging confirmation and leading participation gives a signal worth betting on?”
A Primer on Traditional Technical Indicators
Most traders start with chart indicators because they're visible, accessible, and fast to apply. That's fine. The mistake is stopping there.
Traditional indicators are useful because they convert raw price action into readable patterns. Modern trend analysis is widely described as a statistical technique that identifies patterns over time using methods such as moving averages, exponential smoothing, decomposition, clustering, and ARIMA models, as outlined in NetSuite's overview of trend analysis. In practice, traders mostly interact with the simpler layer of that toolkit.
Start tracking smart money today
Join thousands of traders using WalletFinder.ai to find profitable wallets and copy their trades.
Start Free Trial →

