
Year to Date Performance: Your 2026 DeFi Guide
Master year to date performance in DeFi for 2026. Learn to calculate YTD, interpret signals, avoid pitfalls, and find top wallets with Wallet Finder.ai.
You're scanning wallet rankings, and one address jumps out with a giant year to date gain. Your first instinct is simple: copy it.
That's how a lot of traders get trapped.
A big year to date performance number can point to skill, strong positioning, or early conviction. It can also hide one lucky trade, a tiny starting base, or a strategy that only worked in a narrow burst of market mania. In DeFi, where wallets rotate through memes, perp bets, farming, airdrops, and liquidity games, a single percentage can be both useful and dangerously incomplete.
If you trade by headline numbers alone, you'll end up following noise. If you understand what YTD measures, how it gets distorted, and how to pair it with the right filters, you can use it the way experienced analysts do: as a fast screening tool, not a final verdict.
Understanding Year to Date Performance in DeFi
A wallet shows a massive YTD return. You check the recent trades and see a memecoin entry near the bottom, then a quick exit near the top. It looks brilliant. The problem is that the number itself doesn't tell you whether that trader is consistently good or landed one extraordinary hit.
That's why YTD causes so much confusion. It looks definitive because it's a single clean figure, but it compresses months of behavior into one line. In practice, YTD can be highly sensitive to the start date and recent volatility, so two assets with the same YTD return can carry very different risk profiles, as noted in this market commentary on YTD reliability and start-date sensitivity.
For DeFi traders, that issue gets sharper. Wallets don't just hold spot tokens. They bridge chains, add collateral, harvest rewards, rotate narratives, and sometimes sit inactive for stretches before one explosive trade changes the whole picture.
Why DeFi traders misread YTD
Three mistakes show up again and again:
- They treat YTD as proof of skill. A high return might reflect timing, not repeatable execution.
- They ignore path and risk. Two wallets can arrive at the same result through very different drawdowns and position sizing.
- They skip context. A wallet may be up sharply because of one airdrop, one low-float token, or one early ecosystem bet.
Practical rule: Use YTD to find candidates worth investigating. Don't use it alone to decide who to copy.
The right question isn't “Who has the highest YTD?” It's “Who produced a strong YTD in a way I can understand, trust, and potentially replicate?”
That shift matters. It turns YTD from a vanity number into a research starting point.
What Is YTD Performance and Why It Matters
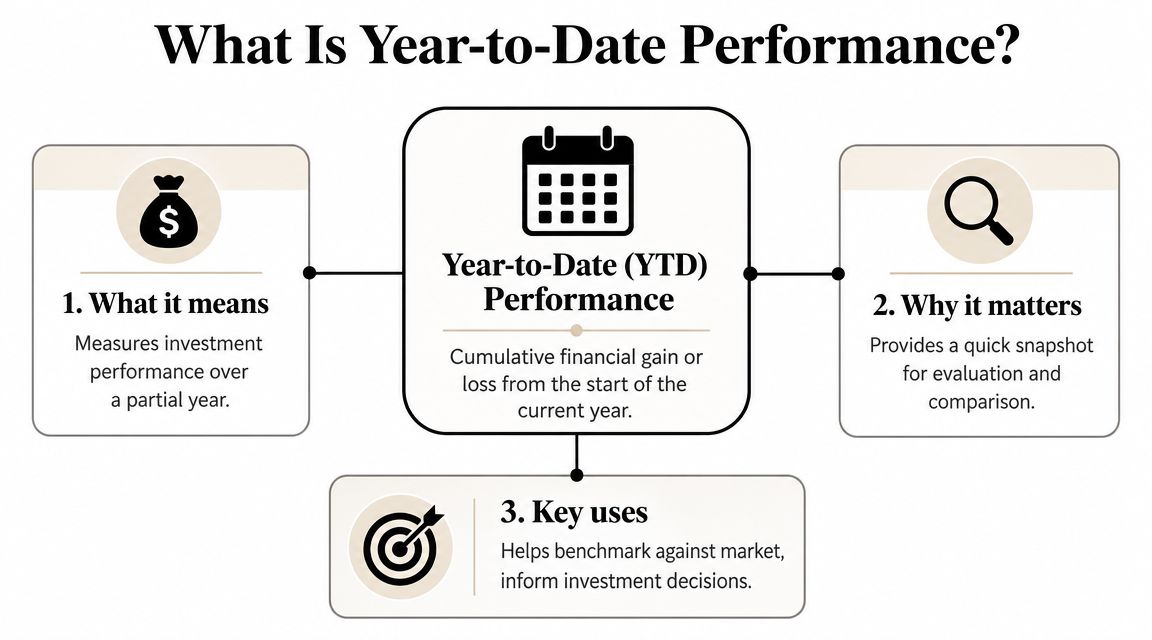
Year to date performance is the cumulative gain or loss from the first trading day of the calendar year up to the latest available point. Think of it as a mid-year report card. It tells you how an asset, strategy, or wallet has done so far this year, but it doesn't tell you everything about how those results were earned.
Start tracking smart money today
Join thousands of traders using WalletFinder.ai to find profitable wallets and copy their trades.
Start Free Trial →

