
Drawdown Analysis: A Trader's Guide to Crypto Risk
Master drawdown analysis to manage risk and protect capital. This guide explains key metrics, formulas, and how to apply them in DeFi with Wallet Finder.ai.
A wallet can look brilliant for months, then hand back most of its gains in a few ugly sessions. That's the part many DeFi traders learn too late. The equity curve looks smooth enough on social posts, the realized wins look impressive, and the copied entries feel smart until the strategy hits stress.
What matters then isn't the screenshot. It's how deep the strategy falls, how long it stays underwater, and whether you still have the nerve and capital to stick with it. That's where drawdown analysis stops being theory and starts becoming survival.
Why Your PnL Chart Is Lying to You
A rising PnL chart hides a lot. It hides the path. It hides the pain between peaks. It hides whether the trader made money cleanly or only by absorbing repeated air pockets that would've forced most followers out at the worst moment.
I've seen traders fixate on total return and ignore how that return was earned. That's backwards. In crypto, two wallets can finish in roughly the same place while taking very different roads. One compounds through controlled pullbacks. The other survives only because it happened to catch a late winner after a stretch of brutal underwater trading.
What a smooth result can hide
A wallet with a flashy top-line gain can still be a bad copy-trading candidate if its history includes:
- Deep collapses: Big peak-to-trough losses that would've made most followers cut risk.
- Long underwater periods: Capital stuck below its old high for so long that better opportunities pass by.
- Violent loss cadence: A pattern of sudden breaks that tells you the strategy can unravel fast.
- Positioning mismatch: Trade sizing that works for the original trader but not for anyone mirroring with less tolerance.
PnL is a summary. Risk lives in the path.
If you're already looking at realized gains and wallet performance, pair that with a proper profit and loss analysis workflow. A gain without context is marketing. A gain with drawdown context is decision-useful.
A wallet isn't safe because it finished green. It's safer only if it stayed survivable on the way there.
The real question
The question isn't "Did this wallet make money?"
The question is "What did it demand from the person following it?"
If the answer is repeated panic, forced exits, and long recovery waits, then the PnL chart is flattering a strategy difficult to maintain through live conditions. Drawdown analysis corrects that distortion. It tells you the historical worst pain, the time profile of that pain, and whether the wallet's style fits your capital preservation rules.
What Is Drawdown Analysis The Core Concepts
Drawdown analysis is easiest to understand if you think like a mountain climber. Your portfolio climbs to a summit, drops into a valley, and then either climbs back to the old summit or finds a new one later. The key risk question is simple. How deep was the valley, and how long were you stuck in it?
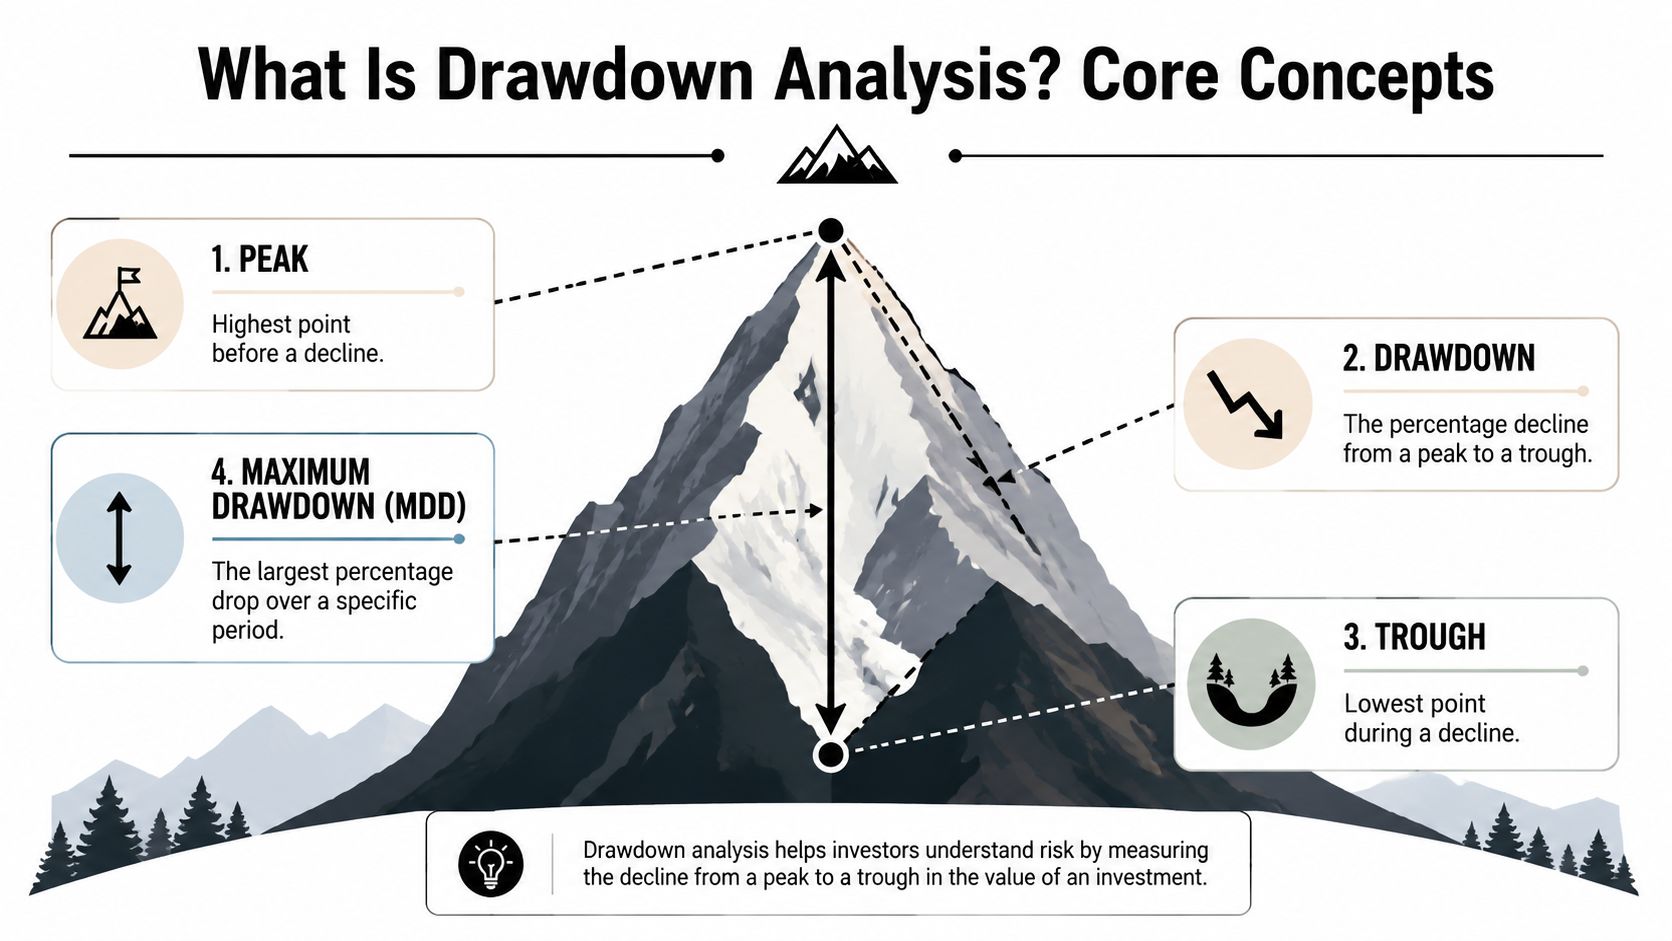
The four terms that matter
- Peak: The highest portfolio value reached before a decline starts.
- Trough: The lowest point reached during that decline.
- Drawdown: The percentage drop from the peak to the trough.
- Maximum drawdown: The single largest observed peak-to-trough decline over the period you're measuring.
Core definition: Maximum drawdown is the historical worst-case pain a strategy imposed from a prior high to a later low.
That last point matters because maximum drawdown is the largest observed decline from a portfolio's peak to its subsequent trough, and it's measured over a specific period, not as some timeless property of the strategy. In practice, a 25% maximum drawdown means the asset fell one-quarter from its highest recent value. Robeco's explanation also highlights Morgan Stanley's recovery framing: about four in five stocks with a 0–50% drawdown eventually regain their prior peak, while only about one in six stocks that fall 95–100% do so (Robeco on maximum drawdown and recovery odds).
Drawdown isn't just depth
Most traders stop at the size of the drop. Professionals don't.
A complete drawdown analysis also looks at the shape of the event:
| Term | What it tells you | Why it matters in trading |
|---|---|---|
| Current drawdown | How far below the latest peak you are now | Helps judge live stress, not just history |
| Drawdown length | How long the portfolio stayed underwater | Shows how much patience the strategy demands |
| Recovery period | How long it took to reclaim the old peak | Reveals whether losses heal fast or linger |
| Path or cadence | How the losses arrived over time | Distinguishes grind-downs from sudden breaks |
Start tracking smart money today
Join thousands of traders using WalletFinder.ai to find profitable wallets and copy their trades.
Start Free Trial →

