
Sensitivity Analysis for Crypto: A Trader's Guide
Learn how to use sensitivity analysis to model crypto portfolio risk, test DeFi strategies, and gain a trading edge. A practical guide for traders.
You enter a trade because the wallet flow looks clean, liquidity seems fine, and the setup has worked before. Then execution hits. Gas spikes, slippage widens, the fill gets worse than expected, and a trade that looked profitable in your notebook turns mediocre or negative on-chain.
That gap between a backtest and a live result is where most traders lose control.
Professionals don't handle that gap with intuition alone. They use sensitivity analysis to pressure-test a strategy before capital is exposed. Instead of asking whether a trade works under one neat assumption set, they ask how the result changes when the messy variables move together. In DeFi, that usually means token price, liquidity depth, slippage tolerance, network fees, and timing.
Beyond Guesswork Your Introduction to Sensitivity Analysis
You track a smart wallet into a new token. The entry looks clean, the wallet has a strong hit rate, and the upside on paper looks worth the risk. Then the trade goes live. Your fill slips, gas jumps, liquidity thins out, and the edge you thought you had gets eaten by execution.
That is the point of sensitivity analysis.
Crypto traders already run rough what-if checks in their heads. What if the entry is worse. What if fees come in high. What if the market moves before the transaction confirms. Useful instinct, but still incomplete. Significant losses rarely come from one variable moving in isolation. They come from several inputs shifting at the same time, usually in the wrong direction.
In DeFi, that matters more than many traders admit. A wallet signal can be valid and still produce a bad trade for anyone following late, sizing too aggressively, or entering a pool with weak depth. Direction is only part of the outcome. Execution quality, fee pressure, and liquidity conditions decide whether a good idea pays.
Sensitivity analysis gives traders a way to test that before capital is on the line. It measures how much the result changes when you adjust the assumptions behind the trade. For a crypto strategy, those assumptions usually include entry price, slippage, gas cost, position size, hold time, and available liquidity. The result might be net PnL, drawdown, expected loss, or the range of outcomes across different market conditions.
Practical rule: If a strategy only works under one narrow set of assumptions, it is fragile.
This matters even more in crypto because inputs are tightly linked. A fast move can worsen your fill, increase the chance of MEV interference, and change your exit options within the same minute. Traders who ignore those dependencies end up treating noise as edge.
The goal is simple. Replace hopeful assumptions with tested ones, then decide whether the setup still deserves capital. For DeFi traders using wallet-level data from tools like Wallet Finder.ai, that turns sensitivity analysis from a textbook concept into a practical filter for copy trades, rotation plays, and on-chain execution risk.
What Is Sensitivity Analysis Really
Think of a strategy like a recipe. You have ingredients, a process, and a final result.
The ingredients are your inputs. In crypto, those might be entry price, exit price, gas fees, slippage tolerance, liquidity conditions, and position size. The process is your model. That could be a manual copy-trading rule, a spreadsheet PnL calculator, or a more serious execution model. The result is the output. Usually that's profit, loss, drawdown, or some risk-adjusted measure.
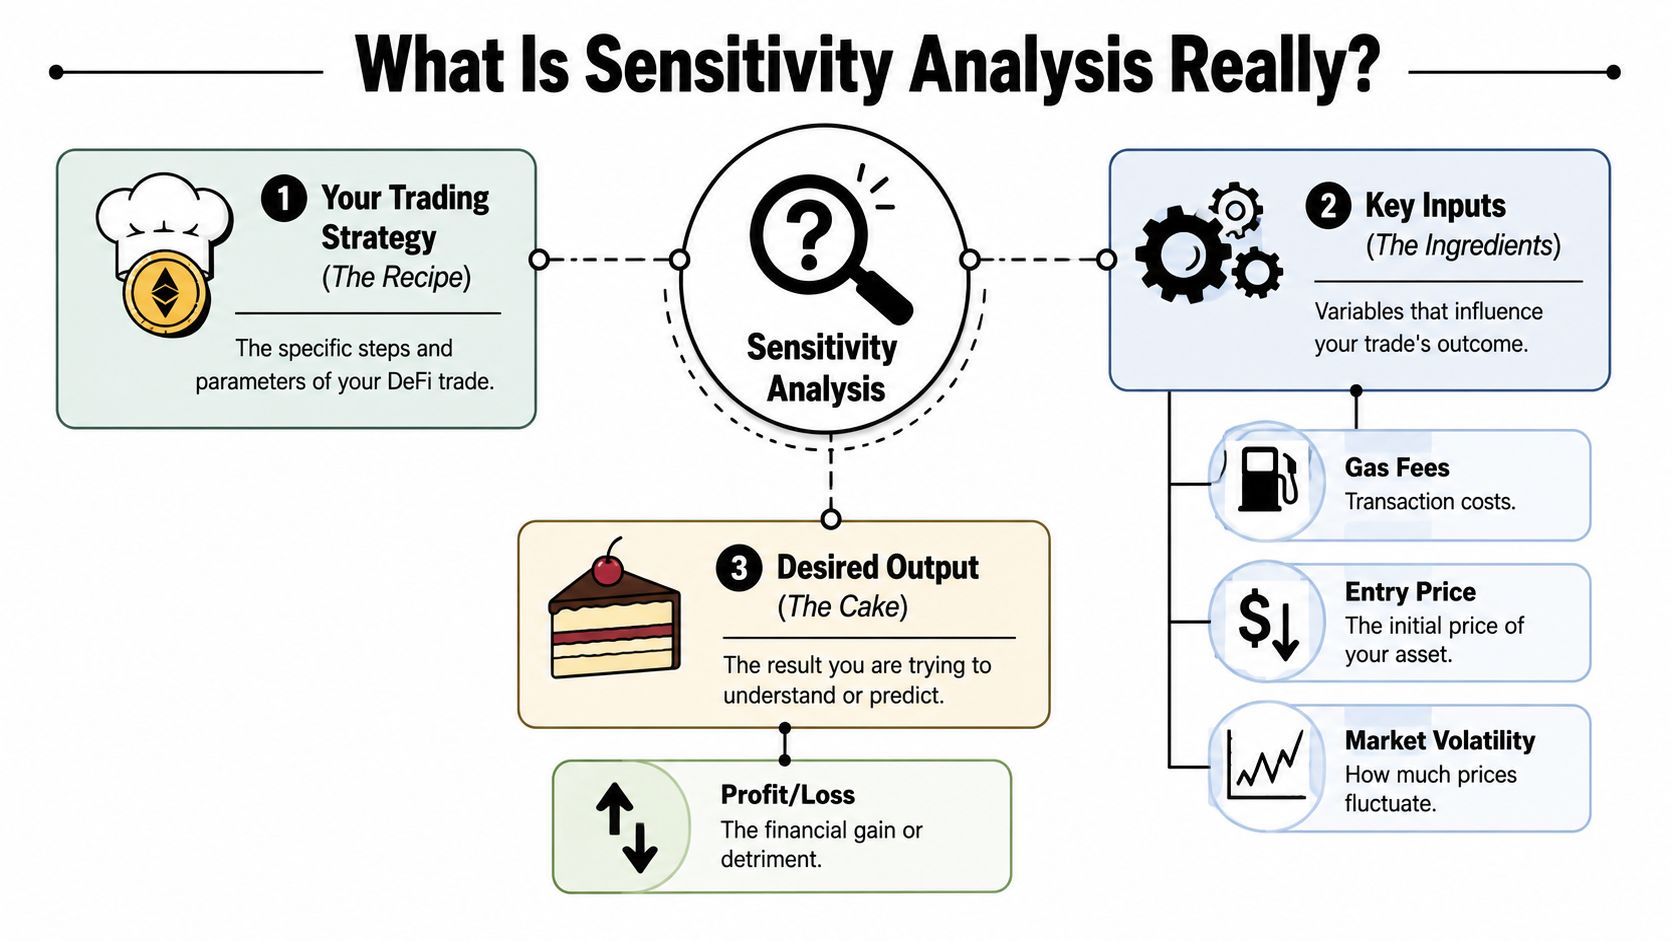
The three moving parts
Sensitivity analysis becomes easy to understand once you separate those parts.
- Inputs: These are the assumptions or observed variables you can change. In DeFi, traders usually start with fees, token price movement, timing, and liquidity.
- Model: This is the rule set that transforms inputs into an outcome. It can be as simple as a spreadsheet formula or as complex as an execution simulator.
- Output: This is what you care about. Most traders focus on net PnL, but max drawdown, fill quality, and loss probability can matter more.
If you change one ingredient and the result barely moves, that input isn't very sensitive. If a small change in one variable wrecks the trade, you've found a key risk driver.
Why traders should care
Sensitivity analysis isn't just a fancy way to make a spreadsheet look quantitative. It's a way to find out where a strategy is brittle.
Suppose you copy a wallet that buys quickly after a breakout. You may think the core risk is price direction. But after testing, you might learn the strategy is far more sensitive to execution timing than to the token's final move. That changes what you monitor, how you size, and whether the setup is worth taking at all.
It also forces cleaner thinking. Traders often mix conviction and model quality. A strong thesis doesn't fix a weak execution framework. Sensitivity analysis separates the two.
A strategy can be directionally right and still fail because the execution assumptions were wrong.
What it is not
It isn't a prediction engine. It won't tell you what the market will do next. It tells you how exposed your result is to uncertainty inside your model.
That's a different question, and often the more useful one.
If you're serious about trading on-chain, that's the shift. Stop treating assumptions like background noise. Put them under stress and see which ones control your outcome.
Key Methods of Sensitivity Analysis
Methods differ in what they reveal. A one-variable test is useful for a fast screen. A broader method is better when slippage, gas, liquidity, and volatility start interacting the way they do in live DeFi trading.
That distinction matters on-chain because inputs rarely move in isolation. Gas spikes during volatility. Liquidity thins out when you want size. Copy-trading a wallet can look profitable in a clean backtest and fail once execution frictions stack up.
One-way analysis
One-way analysis changes a single input while the rest stay fixed.
Use it to identify obvious weak points fast. If raising slippage from 0.5% to 1.5% destroys expected PnL, that is an immediate warning that your edge may depend more on execution quality than on direction. I use this method early because it is quick, easy to audit, and hard to misread.
Its limitation is just as clear. Fixed inputs can hide the underlying source of risk.
Two-way and multi-way analysis
Two-way analysis changes two inputs together. Multi-way analysis extends that idea across several variables.
Models begin to resemble real markets more closely, without yet becoming a full simulation. A DeFi trader might test entry price against gas fee, or liquidity depth against position size. Those pairings often expose zones where a setup works, degrades, or breaks completely.
Multi-way analysis is slower, but it surfaces interaction effects that one-way tests miss. If your strategy only survives when gas is low, liquidity is deep, and fills are fast, that is not a stable edge. That is a narrow operating window.
Scenario analysis
Scenario analysis groups inputs into market states that make sense together.
For crypto, that might mean a launch-day frenzy, a slow grind higher, or a forced-risk-off session after a major exploit. Each scenario should reflect how the market behaves. Higher volatility often comes with worse fills, wider spreads, and less reliable exits.
This method is useful for decision-making because traders place capital into conditions, not isolated variables. It helps answer practical questions. Should this setup be traded only during high-liquidity US hours? Does a wallet-following strategy still hold up when mempool competition increases?
Probabilistic sensitivity analysis
Probabilistic analysis assigns ranges or distributions to inputs and runs many simulations across them.
For active traders, this is often the first method that feels like a real risk tool instead of a spreadsheet exercise. You stop asking for a single expected outcome and start looking at a distribution of outcomes. That shift matters because the median result, the downside tail, and the chance of a severe drawdown can point to very different sizing decisions.
It is also more demanding. You need reasonable input ranges, enough runs to stabilize the output, and enough judgment to avoid feeding the model fantasy assumptions. But if you are testing a strategy with multiple moving parts, this is usually the method that shows whether the edge is durable or just backtest luck.
Comparison of Sensitivity Analysis Methods
| Method | How It Works | Best For | Example |
|---|---|---|---|
| One-way analysis | Changes one input while holding the rest fixed | Fast checks and initial screening | Vary slippage tolerance to see how net PnL responds |
| Two-way analysis | Changes two inputs together | Finding pairwise interaction patterns | Test entry price and gas fee at the same time |
| Multi-way analysis | Changes several inputs across a defined grid or rule set | Stressing a strategy under more realistic combinations | Evaluate token price, liquidity, and fees together |
| Scenario analysis | Bundles multiple input changes into market states | Decision-making under named conditions | Compare “flash crash” versus “trend continuation” |
| Probabilistic sensitivity analysis | Samples across input ranges to generate outcome distributions | Estimating loss risk and tail exposure | Simulate many possible PnL paths for a copy-trading setup |
Start tracking smart money today
Join thousands of traders using WalletFinder.ai to find profitable wallets and copy their trades.
Start Free Trial →

