
Cumulative Volume Delta Guide
Master Cumulative Volume Delta (CVD) with this guide. Learn how to read CVD charts, spot divergences, and apply actionable order flow trading strategies.
Traditional volume bars are a bit one-dimensional. They tell you how much was traded, but they leave out the most exciting part of the story: who won the fight between buyers and sellers?
That's where Cumulative Volume Delta (CVD) comes in. Think of it as your inside look at the real-time battle for control, tracking the net difference between aggressive buying and selling pressure. It’s a powerful way to look ‘under the hood’ of the market.
Going Beyond Price with Cumulative Volume Delta
Price charts are great, but they only show you the final score, not how the game was played. They show the outcome of market action but hide the forces that drove the price there in the first place.
Imagine watching a tug-of-war. The price chart just shows you where the center flag is at any given moment. CVD, on the other hand, tells you how much force each team is pulling with. This is why CVD has become an essential tool for any serious modern trader.
CVD separates the rookies from the pros by distinguishing between aggressive market participants. It keeps a running tally of whether more volume is hitting the ask price (a sign of aggressive buying) or the bid price (a sign of aggressive selling). This gives you a clear lens into the market's true intent.
What Makes CVD a Better Tool
Standard volume indicators just lump all transactions together. CVD gives you directional insight. That difference is huge because it helps you answer the critical questions that price charts can't answer on their own:
- Is this trend for real? If the price is climbing and CVD is also rising sharply, it confirms that aggressive buyers are truly in charge.
- Is this rally losing gas? A new price high without a matching new high in CVD is a classic warning sign that buying pressure is fading, often right before a reversal.
- Who is actually in control right now? CVD cuts through the noise to show you the net result of buying versus selling over any period you choose.
To understand why this is such a leap forward, let's compare CVD directly to the volume indicators most traders are used to.
CVD vs Traditional Volume Indicators
Traditional volume and CVD look at the same raw market data but answer completely different questions, and understanding that distinction is what determines whether you are reading the market's surface or its engine.
Traditional volume's core limitation is that it is non-directional. It tells you how much activity occurred during a given period, but it has no opinion on who was in control of that activity. A candle with massive volume could represent overwhelming buyer aggression, a wave of panic selling, or an evenly matched battle between the two sides that went nowhere. All three scenarios produce the same volume bar. This makes trend confirmation with traditional volume inherently ambiguous, since high volume can appear in both strong uptrends and sharp downtrends without distinguishing between them, and divergence analysis is simply not possible because there is no directional component to compare against price.
CVD resolves all of that by splitting volume into its two constituent forces. Because it tracks whether transactions are hitting the ask, which marks them as aggressive buying, or hitting the bid, which marks them as aggressive selling, every tick of the CVD line carries a directional verdict. A rising CVD line means buyers have been more aggressive than sellers over the measured period. A falling CVD line means sellers have been in control. This directionality is what makes CVD a genuine trend confirmation tool rather than just a measure of activity. When price climbs and CVD climbs alongside it, you have quantitative evidence that buyers are fueling the move. When the two diverge, you have an early warning that the visible price action is not backed by the underlying order flow.
The deepest difference between the two shows up at the level of market psychology. Traditional volume reveals general interest or the lack of it. CVD reveals conviction. A market where buyers are aggressively hitting asks, pushing CVD higher, is a market where participants are willing to pay up for exposure. That behavioral signal, impatience and urgency on one side of the book, is precisely what drives sustained price moves, and it is something traditional volume, for all its simplicity and familiarity, cannot show you.
As you can see, CVD provides a much deeper narrative about what's happening behind the price movements.
Cumulative Volume Delta is a running total of the net difference between buying and selling volume. For example, if buying volume outpaces selling volume by 500 contracts today, the CVD is +500. If tomorrow, selling volume is higher by 300 contracts, the CVD adjusts to +200, always showing the cumulative pressure over time. For more examples, check out this in-depth CVD guide at luxalgo.com.
This layer of information is especially critical in the crypto markets, where momentum and flow are everything. Integrating CVD gives you a serious advantage over traders who are only reacting to price changes.
For an even bigger edge, you can pair this analysis with on-chain data to see what the smart money is doing. We cover this advanced technique in our guide on how to use on-chain analysis effectively. With this foundational understanding of market intent, we can now dive into actionable trading strategies.
Decoding the Math Behind Market Pressure
If you want to trust an indicator, you have to know how it’s built from the ground up. Cumulative Volume Delta (CVD) might sound complicated, but it's really just a running score that tells a powerful story about market aggression. And it all starts with a single trade.
Every transaction is an agreement, a handshake between a buyer and a seller. But one side is always more impatient, more aggressive. The entire calculation for CVD hinges on identifying which side forced the trade through.
The Core Concept: Volume Delta
Think of the market as a constant tug-of-war. The Volume Delta is simply the score after a single pull, usually measured within one price candle. It doesn't care about the total volume; it only cares about the net difference between the aggressive players on each side.
Here’s how we figure out who won that round:
- Aggressive Buyers: These are the traders who can't wait. They blast market orders to buy whatever is available at the current ask price. All of this volume gets a plus sign (+).
- Aggressive Sellers: On the other side, you have traders hitting the bids. They use market orders to sell immediately at the current bid price. This volume is marked with a minus sign (-).
Volume Delta is just the buying volume minus the selling volume for that period. If more volume came from buyers hitting the ask, the delta is positive. If sellers dumped more on the bid, the delta is negative. It's that simple.
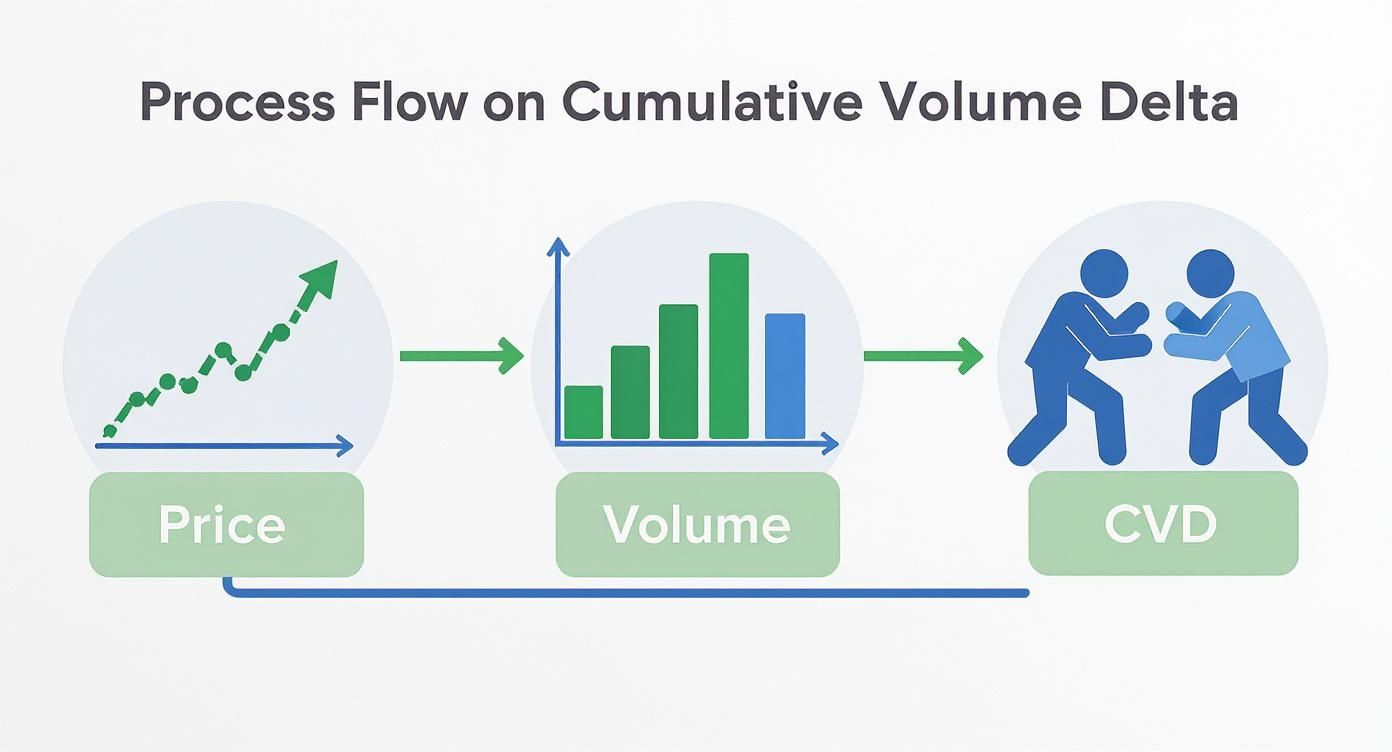
This quick diagram shows how basic price and volume data are transformed into the much more insightful CVD indicator.
Start tracking smart money today
Join thousands of traders using WalletFinder.ai to find profitable wallets and copy their trades.
Start Free Trial →

