
Volume Profile Analysis: A Trader's Guide to Markets
Master volume profile analysis to find true support and resistance. This guide covers core concepts (POC, VA) and applies them to crypto with on-chain signals.
You're probably looking at a chart right now with clean trendlines, a moving average or two, maybe RSI, and price is still reacting in places that don't make much sense. It stalls before your level. It slices through “support” like it wasn't there. Then it reverses exactly where you had nothing marked.
That's usually the point where traders realize price alone isn't enough. You need to know where business got done.
That's what volume profile analysis gives you. It doesn't just show that volume happened. It shows where it happened on the price ladder, which is why it's one of the few tools that can turn a messy chart into a readable auction.
In crypto, that edge matters even more. The market trades around the clock, liquidity is fragmented, and a profile level that looks solid on one chart can fail hard if the move is being driven by wallet flows, token release behavior, or a fresh wave of on-chain accumulation. Used alone, volume profile is useful. Used with blockchain context, it becomes far more practical.
What Is Volume Profile Analysis
A crypto market can print a clean breakout on the chart and still fail within an hour because significant business happened somewhere else. Price shows the path. Volume profile shows where size traded, where inventory likely changed hands, and where the market may care again on the retest.
Volume profile analysis organizes traded volume by price level across a chosen session or range. That changes the job of the chart reader. The question stops being, “How active was this candle?” and becomes, “Which prices attracted participation, acceptance, and repeat trade?”
That distinction matters in crypto because time-based indicators often flatten important context. Bitcoin can trade in a narrow range for hours, then reprice hard on ETF flows, exchange inflows, or large wallet activity. A profile helps isolate the prices that mattered during that process. If you pair it with crypto volume analysis techniques, you get a much clearer read on whether a level is backed by real positioning or just short-term noise.
Why traders use it
Markets move through auction. Some prices attract two-way trade and hold attention. Others get rejected quickly. Volume profile gives that auction a shape you can work with.
The practical value is straightforward. It helps identify where the market found temporary agreement, where it moved too quickly to build agreement, and where a retest is more likely to stall, rotate, or slice through. Those are better trading questions than guessing from candles alone.
In crypto, that edge improves when you confirm the level with blockchain context. A high-volume area means more if large holders accumulated there, exchange balances fell after the move, or smart money wallets defended the zone on pullbacks. If on-chain flows contradict the profile, treat the level with caution. I trust a profile level far less when distribution is hitting exchanges into the retest.
What volume profile is actually good for
Its strength lies in revealing market structure, not in producing automatic buy and sell signals.
A profile can help answer a few high-value questions:
- Where did the market accept price? That is usually where trade was easiest to facilitate.
- Where is inventory likely sitting? Heavy volume areas often mark positions that can influence future reactions.
- Where might price move fast? Thin zones can produce quick repricing once entered.
- Is a breakout being accepted? Continued trade and supportive on-chain flows matter more than the breakout candle itself.
Used well, volume profile gives structure to a market that often feels random. Used poorly, it becomes another overlay traders stare at without asking who is active there.
That trade-off matters. A strong level on the profile is still just a level. In crypto, the higher-probability read comes when that level lines up with participation on the tape, derivatives positioning, and on-chain evidence that larger players are accumulating, distributing, or stepping aside.
Core Concepts of Volume Profile
Volume profile gets useful fast once you stop treating it like another indicator and start reading it as an auction map. It shows where the market found agreement, where it rejected price, and where a move is likely to stall or accelerate. In crypto, that matters even more because price can rip through thin zones in minutes, then spend hours rotating around heavily traded levels while larger holders reposition.
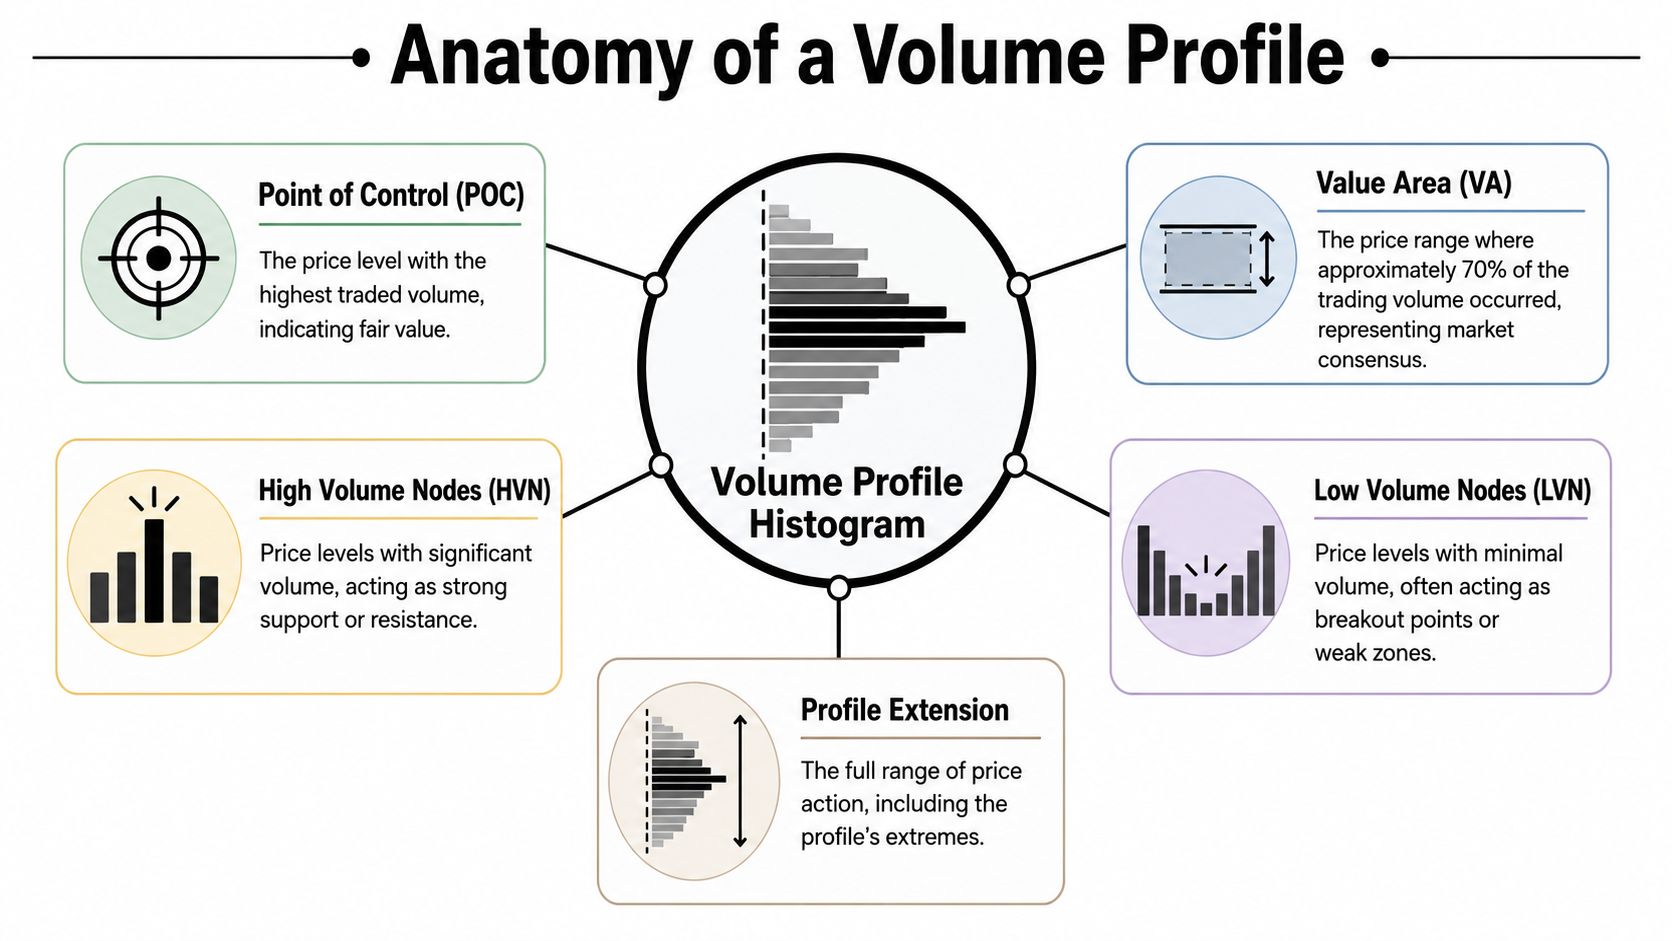
The parts that matter most
The Point of Control, or POC, is the price with the most traded volume in the selected profile. Start there. It often acts like the market's current fair price, at least for that session or range.
The Value Area, or VA, is the price range that contains about 70% of the volume in many standard volume profile settings. Futures and market profile education commonly uses that convention, including CME's explanation of value area, value area high, and value area low in auction-based analysis. Its upper and lower boundaries are the Value Area High (VAH) and Value Area Low (VAL).
What matters in practice is simple:
- POC marks the price that attracted the most business.
- VAH and VAL frame the zone where the market spent most of its effort.
- Outside value is where price is trying to establish a new area of acceptance.
That framework is useful on its own. In crypto, it gets stronger when you pair it with crypto volume analysis and then check whether wallet flows support what the profile suggests. A breakout above VAH means less if exchange inflows spike and large holders start distributing into that move.
HVN and LVN in plain language
A High Volume Node (HVN) is an area where a lot of two-way trade took place. These zones often act as magnets because market participants already did significant business there. If price returns, it usually finds interest again.
A Low Volume Node (LVN) is a thin area with much less participation. Price often moves through those zones quickly, especially in crypto where momentum traders and liquidation flows can push a market through empty pockets fast.
That difference matters more than traders expect.
If price is rotating around an HVN, fading extremes and targeting a return toward heavier trade can make sense. If price enters an LVN with strong participation, fighting the move usually costs money. The better question is whether the market is crossing that thin area to reach the next accepted zone, and whether on-chain activity supports continuation or warns that the move is being sold into.
| Term | Abbreviation | What It Represents |
|---|---|---|
| Point of Control | POC | The price level with the highest traded volume in the selected profile |
| Value Area | VA | The price range containing roughly 70% of traded volume in standard settings |
| Value Area High | VAH | The upper boundary of the value area |
| Value Area Low | VAL | The lower boundary of the value area |
| High Volume Node | HVN | A price area with heavy participation and strong two-way trade |
| Low Volume Node | LVN | A thin price area with relatively little participation |
Start tracking smart money today
Join thousands of traders using WalletFinder.ai to find profitable wallets and copy their trades.
Start Free Trial →

