
Capital Efficiency Ratio: Maximize Your DeFi Returns
Master the capital efficiency ratio. Find winning traders & DeFi strategies with our guide covering formulas, benchmarks, and practical on-chain analysis.
You're scanning wallets after a volatile session. One address shows massive profit. Another has smaller headline gains, but the entries are cleaner, the exits are faster, and the position sizing looks disciplined. Most traders still chase the first wallet because raw PnL is easy to spot.
That's usually a mistake.
A wallet can post huge gains from one oversized punt, one illiquid launch, or one lucky hold through chaos. That doesn't tell you whether the trader allocates capital well. It tells you they made money. Those are not the same thing.
The edge comes from asking a harder question: which trader converts deployed capital into returns with the least waste, least drag, and most repeatability? That's the lens behind the capital efficiency ratio. In traditional markets, operators use it to judge how well a business turns capital into output. On-chain, traders can adapt the same logic to separate real process from lucky screenshots.
If you already review wallet histories and analyze profit and loss across trades, capital efficiency gives you the missing layer. It helps you judge whether gains came from disciplined deployment or from brute-force risk. For DeFi traders, that difference matters more than the PnL number itself.
Beyond PnL The Quest for a Smarter Metric
A familiar trap in DeFi is confusing a spectacular outcome with a strong process.
Take two wallet profiles. Wallet A turns one aggressive bet into eye-catching profit. Wallet B grinds out gains across many trades, rarely overcommits, and keeps capital moving into setups with clear asymmetry. If you only sort by total return, Wallet A wins. If you care about survival and repeatability, the answer is less obvious.
That's why raw PnL is a vanity metric. It collapses several distinct behaviors into one number. It doesn't tell you how much capital the trader had to tie up, how often they recycled it, or whether the result depended on one outlier trade.
What PnL hides
A profit figure can hide at least four things:
- Capital concentration: A trader may have shoved most of the wallet into one position.
- Idle balance drag: A wallet can show good profits while leaving large amounts unused.
- Path dependence: One lucky early win can dominate the whole history.
- Risk asymmetry: The gains may have required exposure that you'd never want to copy.
A trader who makes less money with tighter deployment often has the better system.
That's the practical value of the capital efficiency ratio. It shifts the frame from “who won” to “who used capital best.” For on-chain analysis, that's the difference between following a tourist and studying a professional.
The right question
When I review a wallet, I don't start with the biggest gain. I start with the relationship between output and capital consumed. If a trader repeatedly produces strong outcomes without parking oversized capital in weak setups, that's a real signal. It suggests selection skill, timing discipline, and a better understanding of liquidity and risk.
For DeFi traders, this is especially useful in noisy environments. Token launches, volatile rotations, and fragmented liquidity can make random winners look like masters. Capital efficiency helps filter that noise. It rewards traders who deploy with intent, not traders who merely survive long enough to post one giant screenshot.
What Is the Capital Efficiency Ratio
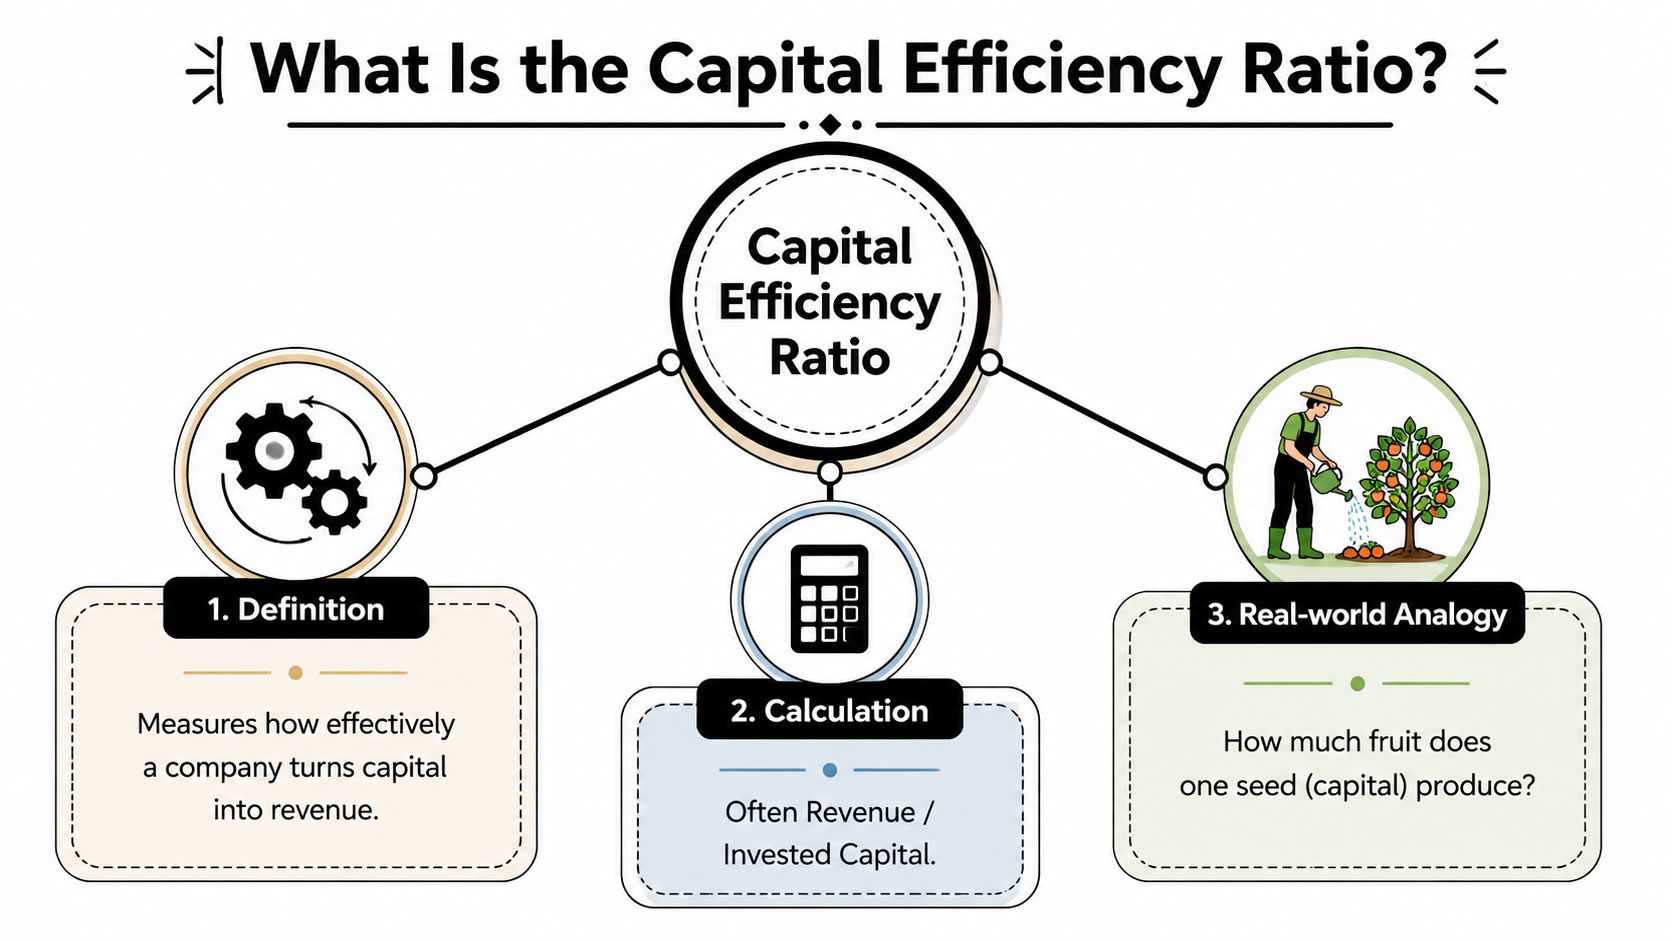
At its core, the capital efficiency ratio answers a blunt question: how much output did you get for the capital you put to work?
Think of two farmers with the same harvest. One needed far more land, seed, and equipment to produce it. The other got the same result with fewer inputs. The second farmer is more capital efficient. Same output. Less capital tied up. Better use of resources.
That logic travels cleanly into finance.
The traditional finance definition
In broad finance usage, capital efficiency is often measured as revenue divided by total capital employed. A ratio of 2.0x means a business generates $2 of revenue for every $1 of capital employed, and higher generally means capital is being used more effectively, as outlined in this capital efficiency ratio reference from Monitask.
That matters because capital employed usually refers to the long-term funding base behind the business, not just whatever cash happened to move through the account. In practice, analysts often frame it around shareholders' equity plus long-term debt. The point is simple: how much productive output came from the capital base supporting the operation?
Why the idea matters beyond companies
The concept isn't limited to public companies or CFO dashboards. It's a universal performance question. Any time you can define capital input and useful output, you can evaluate efficiency.
For DeFi traders, that's immediately relevant. You deploy stablecoins, ETH, SOL, or other inventory into trades. You absorb gas, slippage, and opportunity cost. Some traders need lots of capital to produce modest gains. Others rotate quickly, size well, and extract more output from less committed capital.
Practical rule: Capital efficiency is “bang for your buck” with stricter accounting.
What it tells you
Used properly, the metric reveals things that PnL alone won't:
- Resource discipline: Did the trader need huge deployment to earn the result?
- Operational quality: Are they allocating capital to the strongest setups?
- Comparability: Can you compare operators of different size on a common basis?
- Sustainability: Does the wallet look scalable, or does it only work with reckless sizing?
A lot of confusion starts when people treat capital efficiency as one fixed formula. It isn't. The principle stays the same, but the exact formula changes with context. That's where most DeFi traders need to get sharper.
Calculating Capital Efficiency in Finance and DeFi
The phrase capital efficiency ratio sounds singular, but in practice it isn't. Different markets use different formulas because they're trying to answer slightly different questions. That mismatch is one reason many explainers feel incomplete.
As noted in this overview of efficiency ratio differences across finance contexts, some definitions use net sales divided by total capital employed, while startup and SaaS operators often use ARR or gross profit against capital raised or burned. Same idea. Different measurement frame.
Capital Efficiency Formulas Across Different Contexts
| Context | Formula | What It Measures |
|---|---|---|
| Traditional finance | Revenue or net sales / total capital employed | How effectively a business turns its long-term capital base into revenue |
| SaaS and startups | (Total Equity + Total Debt - Cash) / ARR | How much capital was consumed to build recurring revenue |
| DeFi trading | Net PnL / total capital deployed | How much trading output a wallet generated from capital actually put at risk |
Start tracking smart money today
Join thousands of traders using WalletFinder.ai to find profitable wallets and copy their trades.
Start Free Trial →

