
Mastering Volatility Measurement in DeFi & Crypto
Volatility measurement - Master volatility measurement for DeFi & crypto. Learn key metrics (ATR, historical volatility), on-chain signals, and risk management
A trade looks clean on the chart, the wallet you follow has started building size, and the token has held support for hours. Then the market lurches. Your stop gets hit, price overshoots, liquidity thins out, and the move that looked manageable turns into a scramble. Most traders call that “bad luck.”
Usually it's bad volatility measurement.
In DeFi, volatility isn't just how far price moves. It's how violently price moves, when that movement happens, how hard it is to execute during that move, and whether derivatives or on-chain flows were already warning you before the candle printed. If you trade on-chain and still rely on a single chart indicator borrowed from equities, you're using a partial map in a market that never closes.
Why Most DeFi Traders Misjudge Volatility
The familiar failure pattern looks like this. A trader sees a token grinding higher in a narrow range and assumes risk is low because the chart looks calm. They size up, maybe increase their exposure, maybe mirror a wallet entry. Then a burst of selling hits during a thin-liquidity window, the range breaks, and slippage does more damage than the candle itself.
That mistake starts with treating volatility as a visual impression instead of a measured condition.
A lot of DeFi traders still judge market risk by asking one question: “How big have the candles been?” That's too shallow for an always-on market. A token can look quiet while liquidity is deteriorating, while funding is getting unstable, or while large wallets are rotating inventory toward venues where liquidation pressure can build fast. In meme tokens and thinner pairs, that disconnect gets even worse, which is why low liquidity increases meme token volatility in ways a simple chart scan won't capture.
What gets missed in practice
- Execution risk gets ignored. Traders measure price movement but not how much harder it becomes to enter or exit once the move starts.
- Time-of-day effects get ignored. Crypto trades around the clock, but not all hours offer the same depth.
- Derivatives pressure gets ignored. Spot can look calm right before significant derivative positions force a sharp move.
- Wallet behavior gets ignored. Smart money often changes posture before volatility becomes obvious on a chart.
Volatility hurts most when traders confuse a quiet chart with a safe market.
The traders who survive this space longest don't try to predict every move. They build a better read on market conditions first. That changes position size, stop placement, pair selection, and whether a signal is worth taking at all.
Understanding Volatility Beyond Price Swings
A token can close flat on the day and still be dangerous to trade.
That happens all the time in crypto. Price ends near where it started, but the route there includes thin order books, sudden liquidity withdrawals, a burst of liquidations on perp venues, and wide execution slippage for anyone trading size. If you measure volatility only from closing prices, a lot of that stress disappears from view.
Volatility measurement starts with a distinction many traders skip. Price direction tells you whether the asset moved up or down. Price level tells you where it trades now. Volatility tells you how unstable the path was, and in DeFi that path often matters as much as the destination.
Two tokens can print the same daily return and offer completely different trading conditions. One moves in a steady market with consistent depth. The other chops through air pockets, wicks through stop clusters, and gaps between liquidity bands on DEXs. On paper, the return looks similar. In practice, the second market is far harder to hold and far more expensive to trade.
Historical volatility and implied volatility
The first category is historical volatility, also called realized volatility. It looks backward and asks how much returns have varied over a chosen sample. In standard market practice, that usually means calculating the standard deviation of returns over a set window, often from daily closes, then annualizing it.
That works well enough as a baseline. It gives traders a common yardstick for comparing assets, regimes, or time periods.
It also breaks in a 24/7 market if used alone.
Crypto does not have a clean open and close like equities. Volatility can build during low-liquidity hours, then get expressed later when larger flow returns. A close-to-close measure can understate what happened, especially for on-chain assets where liquidity is fragmented across pools and venues.
The second category is implied volatility. It is inferred from options prices and reflects what the options market is pricing in for future movement. In traditional markets, implied volatility is often a useful forward-looking signal because options books are deep and continuously traded.
In DeFi, that signal is less consistent. Some assets have no meaningful options market. Others have options liquidity that is too thin to trust as a broad market estimate. So traders often borrow the concept of implied volatility without having the market structure that makes it reliable in TradFi.
Why this distinction matters for DeFi
For on-chain trading, the gap between realized volatility and tradable risk is wider than many traders expect.
A token may show moderate historical volatility while the actual setup is deteriorating. LP depth can shrink. Bridge flows can become one-sided. A few large wallets can pull inventory from pools. Perp funding can get crowded in one direction. None of those conditions need to appear clearly in a basic volatility series, yet each one can turn a normal move into a disorderly one.
That is why volatility should be treated as one layer of market risk, not the whole map. A cleaner framework combines price dispersion with liquidity quality, execution conditions, and positioning pressure. This explanation of volatility vs risk in liquidity pool token analysis is useful if you want the distinction laid out more explicitly.
A practical reading of volatility
For trading decisions, volatility measurement should answer three questions:
- How large is the normal move for this asset in this market regime?
- How messy is the path between entry and target?
- What happens to execution if volatility expands while I am in the trade?
That third question matters more in DeFi than many chart-based systems admit. In equities, a volatility spike is often discussed as a price problem. On-chain, it is also a liquidity problem. The same position can become harder to exit just as risk rises.
Practical rule: A market is only calm when price movement, liquidity, and positioning are stable at the same time.
The Trader's Toolkit of Volatility Metrics
A token can show the same daily realized volatility as another asset and still be far harder to trade. One has thick books, steady pool depth, and orderly funding. The other trades fine until liquidity thins, then slips 3 percent on a medium-sized order. That is why DeFi traders need a toolkit, not a single volatility number.
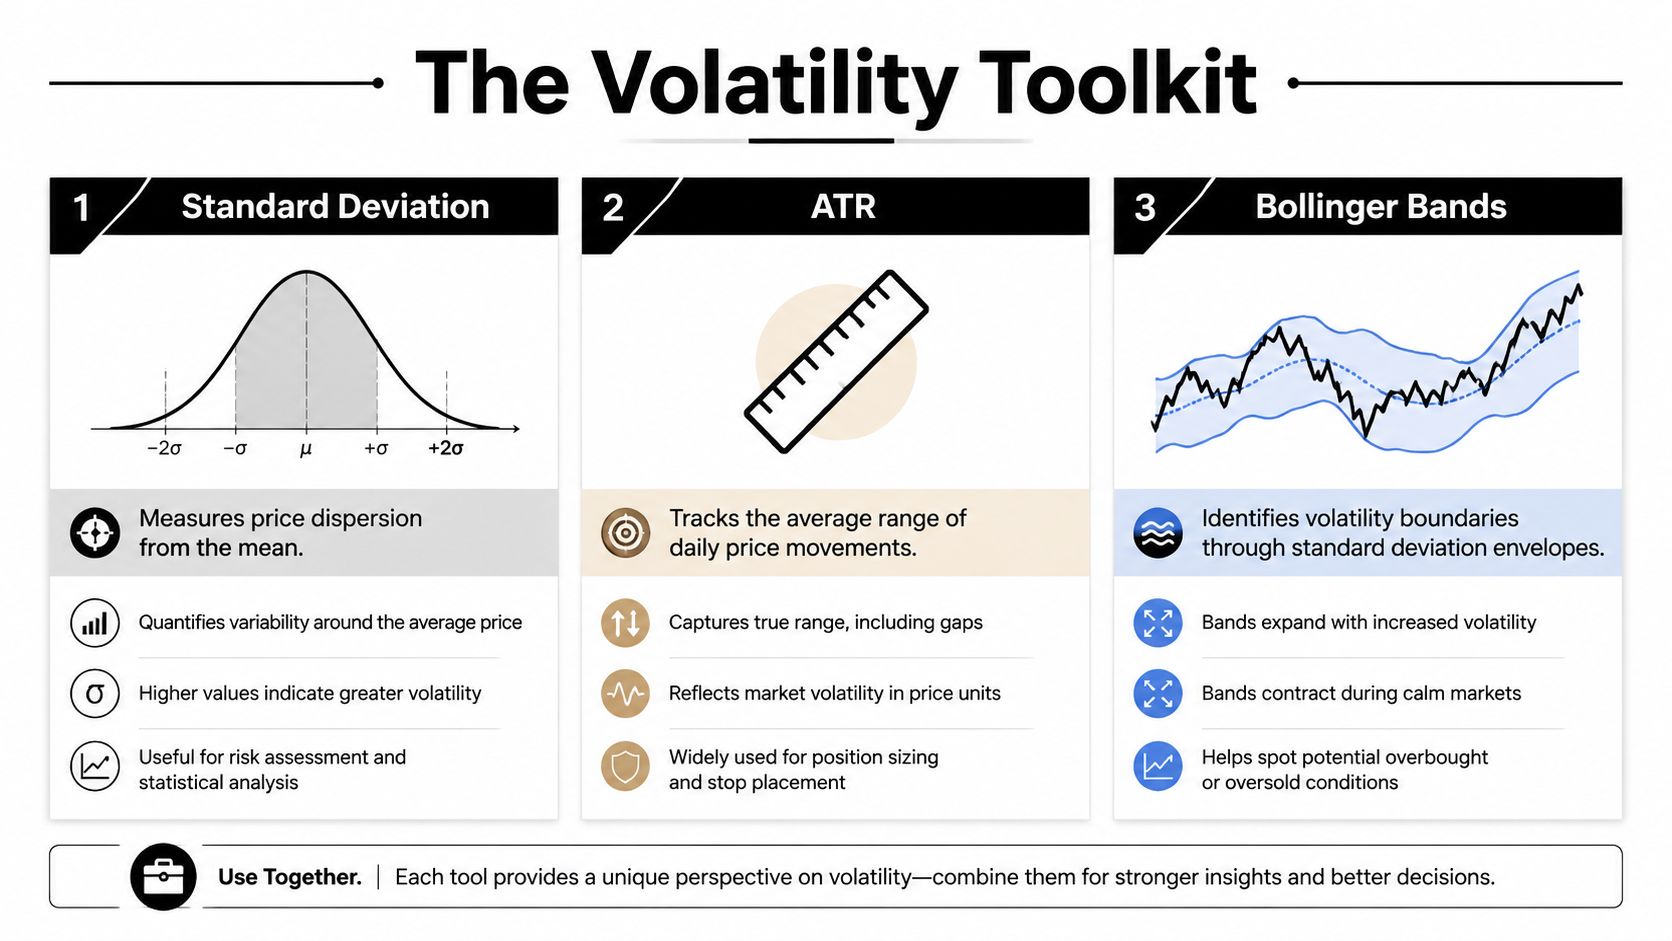
Standard deviation
Standard deviation is the base layer for volatility work. It measures how widely returns spread around their average. In practice, it helps answer a simple question: are recent moves staying near the usual range, or are they starting to scatter?
That makes it useful for screening assets, comparing regimes, and building a baseline before adding more context. A quant desk will usually start here because many other volatility measures are just variations on this idea.
Its limitation in crypto is obvious once you trade around the clock. Close-to-close returns can look calm while the market went unstable for several hours overnight, then mean-reverted before the daily candle finished. For DeFi markets, that missing path matters because execution risk often shows up before end-of-period data does.
Historical volatility
Historical volatility turns recent return dispersion into a percentage that is easy to compare across tokens and timeframes. It is a clean dashboard number. It is also easy to misuse.
For ranking assets, it does the job well. If one token has been moving much more than another, the trade usually needs smaller size, wider stops, or both.
The problem is that annualized historical volatility smooths the timing of the stress. In equities, that can be acceptable because trading hours are fixed and liquidity patterns are more stable. In crypto, the same reading can hide whether the turbulence happened during active hours with deep liquidity or during thin hours when a modest order can push price far off fair value.
ATR
Average True Range, or ATR, is one of the few volatility metrics that maps directly to trade management. It measures the typical range a market travels over a period, which makes it practical for setting stops, estimating required breathing room, and checking whether a breakout has real expansion behind it.
For DeFi traders, ATR is useful because it connects analysis to order placement:
- Stop distance for discretionary entries
- Position sizing so one volatile token does not dominate portfolio risk
- Breakout filtering when price starts moving but range has not expanded enough to confirm the move
ATR still has blind spots. Crypto does not have the same session gaps as equities, but it does have liquidity gaps. A token can print a normal-looking ATR while the actual problem is that depth disappears at specific hours or on specific venues. ATR tells you how far price has been moving. It does not tell you how expensive it will be to get out.
Bollinger Bands
Bollinger Bands are less useful as a pure risk measure and more useful as a visual map of compression and expansion. They wrap price in a moving envelope based on standard deviation, so traders can quickly see when the market is tightening or starting to fan out.
That is helpful for pattern recognition. It is weaker for decision-making on its own.
In on-chain markets, band compression can persist because flows are waiting on a catalyst, not because risk has fallen. A breakout through the band can also be misleading if it is driven by liquidations or a temporary hole in pool depth rather than broad demand. Used alone, bands often overstate the quality of the signal.
Parkinson and other intraday estimators
Range-based estimators such as Parkinson are more useful in 24/7 crypto because they use intraperiod information instead of relying only on closes. That makes them better at catching markets that stay noisy inside the day even when the final return looks moderate.
This is closer to how traders experience volatility. PnL is affected by the path, fills, and slippage, not just by where the candle closes.
These estimators still need clean data. On-chain assets often trade across fragmented venues, with varying liquidity quality and occasional price distortions from thin pools. If the underlying data is messy, the estimate can look precise while reflecting noise. The fix is to pair price-based estimators with venue and liquidity checks, such as a routine to check on-chain liquidity and wallet activity before a trade.
Comparison of Common Volatility Metrics
| Metric | What It Measures | Best For | Crypto-Specific Caveat |
|---|---|---|---|
| Standard Deviation | Dispersion of returns around the average | Baseline comparison and quantitative screening | Close-only data can miss intraday instability and venue fragmentation |
| Historical Volatility | Standard deviation of returns expressed as an annualized percentage | Ranking assets by recent realized movement | A clean annualized figure can hide when volatility and slippage actually occurred |
| ATR | Average realized range over time | Stop placement, breakout filtering, position sizing | Useful for trade management, but it does not capture depth loss or execution stress |
| Bollinger Bands | Volatility envelopes around a moving average | Visualizing compression and expansion | Helpful for context, weak as a standalone signal in thin on-chain markets |
| Parkinson Estimator | Range-based realized volatility using high-low data | Capturing intraday movement more fully | Better for 24/7 markets, but sensitive to poor venue data and distorted prints |
Start tracking smart money today
Join thousands of traders using WalletFinder.ai to find profitable wallets and copy their trades.
Start Free Trial →
