
What Drives the Price of IC?
Uncover what drives the price of IC. This guide explores the Internet Computer's value, historical data, and how to use on-chain signals for smarter trading.
The price of IC is a moving target, constantly shifting based on its real-world adoption, how much it’s actually being used on the Internet Computer network, and the crypto market's overall mood swings. Think of it as the native currency for a decentralized 'world computer' aiming to take on giants like Amazon Web Services. Because of that, its value is deeply connected to actual developer activity and real use cases, not just speculation.
What Is IC and What Influences Its Price
When you’re looking at the price of IC, it helps to shift your perspective. Don’t think of it as just another crypto coin. It’s much closer to owning a piece of foundational technology, like having stock in a company building the next internet. The whole point of the Internet Computer is to be the new home for decentralized apps (dApps) and services. And just like a tech stock climbs when its products take off, IC’s value is tied to its network’s growth.
At its heart, the IC token is the fuel that powers this entire ecosystem. Developers have to convert IC into "cycles" to pay for things like computation and data storage—it’s their version of paying for server space. So, the more developers that build and run their dApps on the Internet Computer, the higher the demand for cycles becomes. This, in turn, drives up the demand for the IC token itself.
Core Drivers of the IC Token Price
But it's not just a simple game of supply and demand. A few key factors are always at play, creating a dynamic environment where the token's price is constantly reacting to new information and what’s happening on-chain. Getting a grip on these drivers is the first step to making smarter trading decisions.
Here's a breakdown of the primary elements that influence the value of the Internet Computer (IC) token.
FactorDescriptionPotential Price ImpactNetwork Adoption & UtilityThe more developers build on IC and the more users interact with dApps, the more IC is needed for "cycles" (computation fees). This is the purest measure of real-world demand.Strongly Positive: High adoption directly increases demand for IC tokens to be converted into cycles, pushing the price up.Tokenomics (Staking & Burning)A significant portion of IC is locked (staked) in the Network Nervous System (NNS) for governance, reducing the tradable supply. Additionally, converting IC to cycles effectively "burns" tokens, permanently removing them from circulation.Positive: Staking and burning create deflationary pressure. A shrinking supply with steady or growing demand is a classic recipe for price appreciation.Broader Market SentimentIC doesn't exist in a vacuum. Its price is heavily swayed by the overall crypto market. If Bitcoin is surging, IC often follows. If the market is fearful, IC will feel the impact.Variable: Can be positive or negative. A bull market can lift all boats, while a bear market can drag IC down regardless of its own fundamentals.Ecosystem & dApp GrowthThe launch of popular dApps, especially in sectors like SocialFi or GameFi, can attract thousands of new users to the network, creating a surge in demand for IC.Positive: Major dApp launches act as catalysts, boosting both network utility and speculative interest.
Understanding these factors is crucial because they give you the context behind the price chart. It’s not just random numbers; it’s a reflection of network health, token mechanics, and market psychology.
Actionable Tip: A rising number of dApps and active users directly translates to a higher burn rate for IC tokens. This creates a natural supply squeeze that can positively impact price. Monitor the IC dashboard on sites like DappRadar to track this growth.
A Trader's Guide to IC Price History
If you want to get a real feel for the price of IC today, you have to look at where it's been. The token’s journey is a classic crypto tale: massive initial hype, a brutal correction during the crypto winter, and then a slow, steady grind back up. This isn't just a chart with random squiggles; it's a story that shows just how tuned-in the token is to the wider market's mood swings.
The Internet Computer (ICP) token’s launch in early 2021 was nothing short of explosive. It shot up from about $131 in March to a mind-boggling all-time high of $700.65 on May 10, 2021—that’s a 434% surge in just two months. For a moment, ICP was a top-tier project.
But then the crypto winter came, and it hit hard. By the end of 2022, the token had cratered 88.55% to $3.94, getting dragged down with the rest of the market. Still, ICP didn't die. In 2023, it clawed back with a 231.35% rebound to $13.30 as interest in scalable blockchains picked up again. For DeFi traders, this rollercoaster history hammers home one point: track the smart money. The traders who used tools like Wallet Finder.ai to mirror wallets accumulating below $10 locked in some serious gains. You can dig into the full price history yourself on sites like CoinGecko.
The Cycles Burn Rate: IC's Hidden Supply Destruction Mechanism
The article above correctly identifies that IC gets converted to cycles to pay for computation, and that this conversion burns IC permanently. What it doesn't tell you is how to actually use the burn rate as a leading indicator for price movements, or that the burn rate varies dramatically based on network utilization in ways that are completely predictable once you understand the pattern.
The cycles burn mechanism is deflationary by design. Every time a developer pays for computation or storage on the Internet Computer, they convert IC tokens into cycles at a dynamically calculated rate. Those cycles get consumed as the dApp runs, and the IC tokens that created them are gone forever — burned out of existence. This isn't a one-time event. It happens continuously as long as the network is processing computation.
The burn rate isn't static. It fluctuates directly with network activity. When more dApps are running and more users are interacting with those dApps, cycles consumption increases, which means more IC needs to be converted to cycles to sustain that activity. High network activity equals high burn rate. Low network activity equals low burn rate. The relationship is mechanical, not speculative.
How to Read the Burn Rate Trend
The burn rate data is publicly available on the Internet Computer dashboard, but most traders don't know what to do with it beyond acknowledging that "burns happen." The actionable version requires tracking the burn rate over time and looking for acceleration or deceleration in the trend.
Burn rate acceleration — when the daily IC burn increases week-over-week for multiple consecutive weeks — signals that network utilization is growing. This is a structural positive for IC price because it means demand for the token is increasing for its core utility purpose, not just speculation. When developers need more cycles to support growing user bases on their dApps, they buy IC and convert it. That buying pressure, combined with the supply reduction from the burn itself, creates dual upward price pressure.
Burn rate deceleration — when the daily burn decreases week-over-week — signals declining network utilization. This is often an early warning that dApp activity is slowing, user engagement is dropping, or developers are scaling back their applications. The reduced need for cycles means less IC gets converted and burned, removing both the buying pressure and the deflationary benefit. Prices can remain elevated on speculation alone for a while, but sustained burn rate deceleration eventually shows up as price weakness once the market catches up to the reality.
The lag between burn rate changes and price impact varies depending on market conditions. During bull markets when sentiment is strong, burn rate deceleration might not matter for weeks because speculative buying overwhelms the signal. During bear markets or neutral periods, burn rate changes show up in price action much faster because there's less speculative cushion absorbing the fundamental shift.
The Compounding Effect of Network Growth
What makes the burn mechanism particularly powerful over longer timeframes is that it compounds. A network with a million users burns more IC daily than a network with ten thousand users, but the difference isn't linear — it's exponential if those users are interacting with resource-intensive dApps like social platforms or games.
This means that as the Internet Computer adds more users and more complex applications, the burn rate doesn't just grow — it accelerates. The gap between a ten percent user growth month and a twenty percent user growth month isn't ten percent more burn. It could be twenty-five or thirty percent more burn depending on what those new users are doing.
Tracking the burn rate alongside user growth metrics gives you a forward-looking view of supply dynamics. If user growth is strong but burn rate isn't accelerating proportionally, it suggests the new users aren't engaging deeply with the network — they're creating wallets but not actually using dApps in a way that requires significant computation. That's a yellow flag for growth quality. If user growth is moderate but burn rate is accelerating faster than user growth, it means existing users are engaging more intensely or new dApps are more resource-intensive, both of which are structurally positive.
Key Phases in IC Price History
For a trader, knowing these historical phases is everything. It gives you the context to understand what’s happening right now. Each period had its own unique on-chain signals and opportunities, especially for those paying attention. Let's break down the timeline so you can spot the patterns.
- The Hype Phase (Q2 2021): Pure euphoria driven by retail FOMO. The price of IC was fueled by the project's grand vision, not its actual utility. Smart money wallets that sold into this madness made life-changing returns.
- The Correction Phase (Late 2021 - 2022): The bear market took over. IC got hammered, shaking out speculative traders and allowing the price to find a floor. On-chain, this was marked by huge inflows to exchanges as people rushed to sell.
- The Rebuilding Phase (2023 - Present): This is the current chapter, defined by real progress. Developers are building, the ecosystem is growing, and the price is now more tied to fundamentals like dApp launches and network activity.
This timeline gives you a visual breakdown of what was moving the IC price during each of these cycles.
As you can see, the market drivers have grown up. We've moved from pure hype to actual network adoption and solid tokenomics. Getting a handle on this evolution is what separates a decent trading strategy from a great one.
Using On-Chain Data to Predict Price Moves
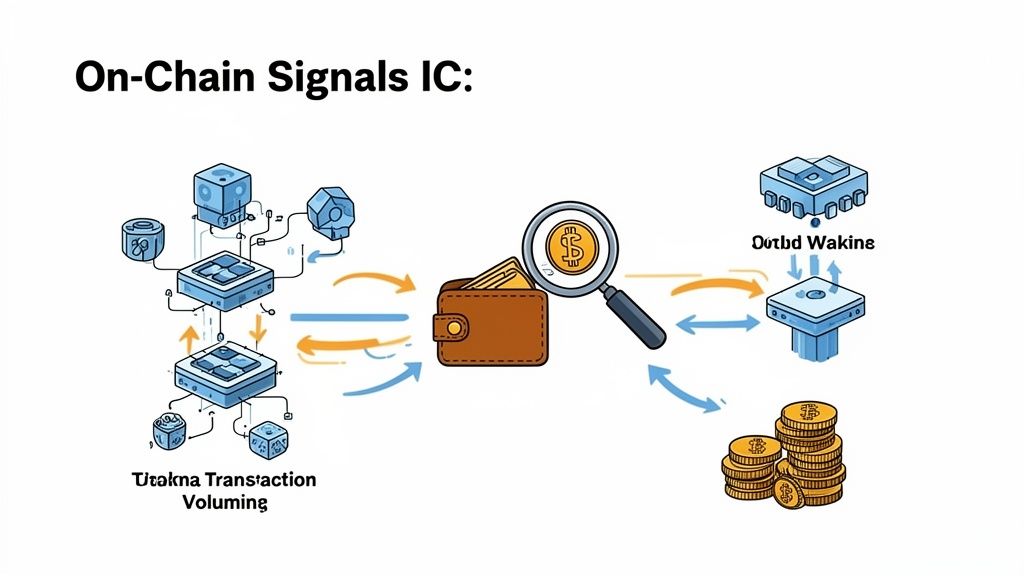
Price charts show where a token has been, but they only tell half the story. To get a real edge in figuring out where the price of IC is headed, you need to dig into on-chain data. Think of it like this: a price chart is a replay of the game. On-chain data is a peek at the coach's playbook during the game.
Start tracking smart money today
Join thousands of traders using WalletFinder.ai to find profitable wallets and copy their trades.
Start Free Trial →
