Your Guide to the Crypto 2FA Code
Secure your assets with our guide to the crypto 2FA code. Learn how to set up, manage, and recover 2FA to protect your portfolio from hackers.

April 6, 2026


Wallet Finder
February 19, 2026
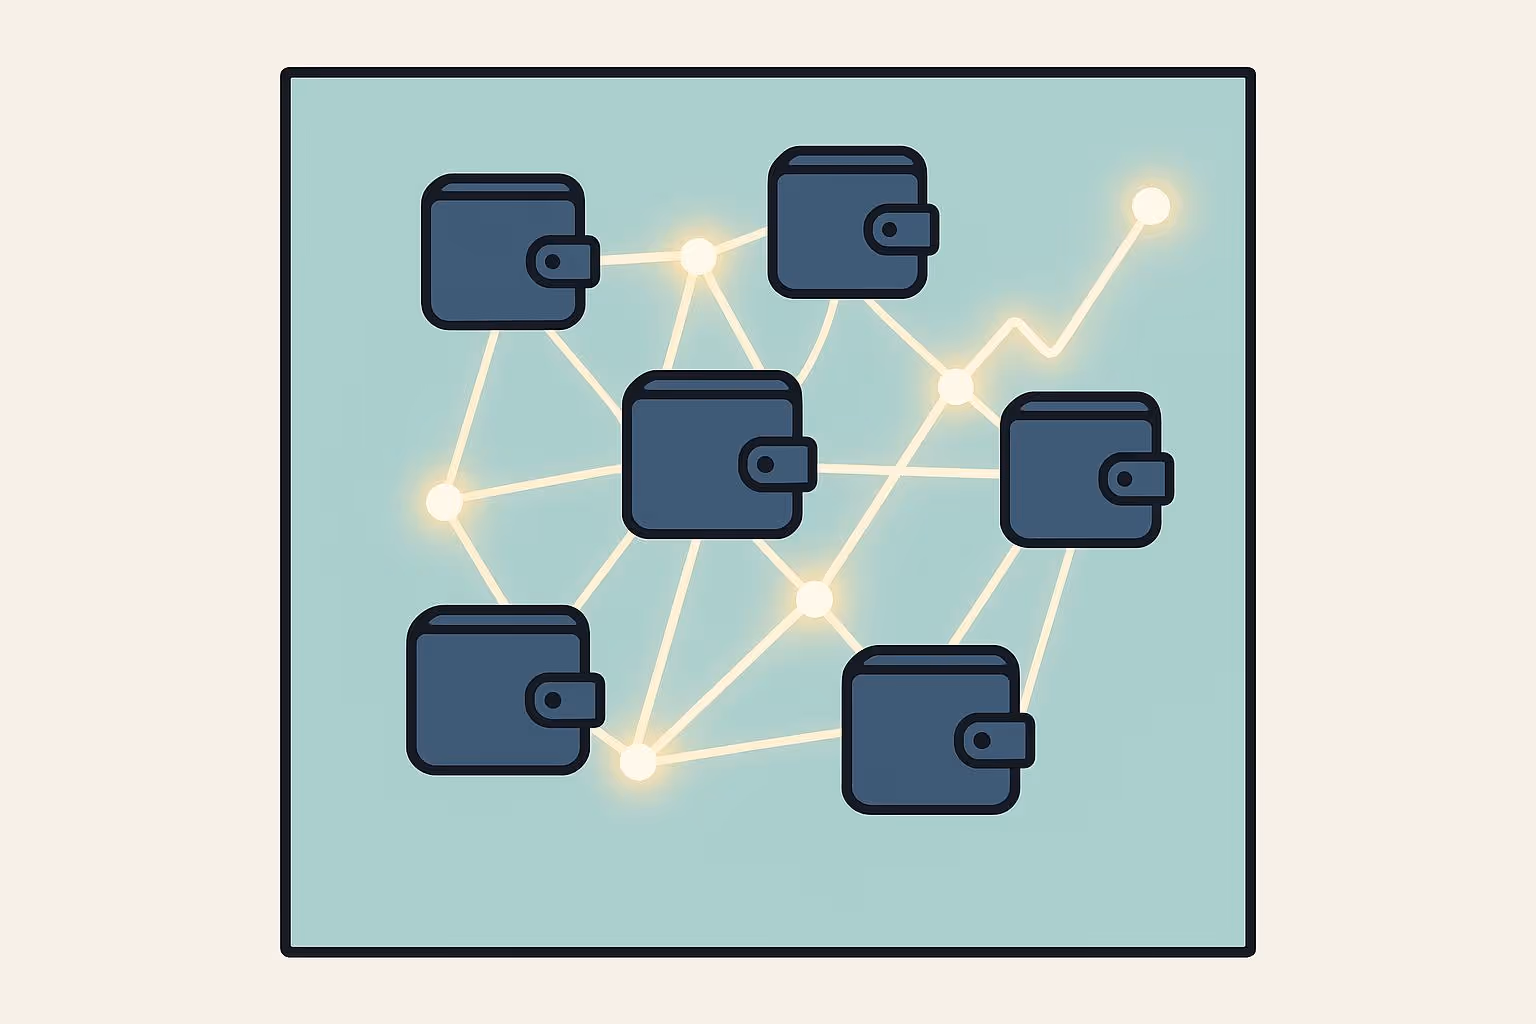
Wallet clusters are groups of blockchain wallets controlled by one entity, and they reveal hidden trading patterns in DeFi markets. By analyzing their transactions, you can spot coordinated activities that often signal big market moves before they happen. Here's what you need to know:
Identifying wallet clusters involves analyzing blockchain data to uncover patterns and connections. By examining transaction behaviors, timing, and similarities across multiple addresses, you can spot coordinated activities that might hint at upcoming market trends.
To detect wallet clusters, focus on specific metrics that reveal coordinated behavior:
Once you've identified these patterns, on-chain analytics tools can help you dig deeper and turn raw data into actionable insights.
Platforms like Wallet Finder.ai simplify this process by offering features such as real-time tracking, custom watchlists, and detailed visualizations. With tools like these, you can monitor wallet activities, analyze trading strategies, and identify clusters more efficiently.
Real-time monitoring is key to staying ahead of market movements:
For instance, Wallet Finder.ai provides real-time updates via Telegram, ensuring you’re always informed about significant wallet activities. Its multi-network monitoring capabilities cover Ethereum, Binance Smart Chain, Polygon, and more, giving you a broader perspective on coordinated behaviors.
The article covers basic cluster identification but misses the sophisticated mathematical frameworks that can systematically detect and validate wallet clusters using graph theory, network topology analysis, and machine learning algorithms. Advanced cluster detection goes beyond manual pattern recognition to identify coordinated wallet behavior with statistical significance and confidence intervals.
Graph-based cluster analysis treats blockchain addresses as nodes and transactions as edges, creating network structures that reveal hidden relationships between wallets. Centrality measures like betweenness centrality and eigenvector centrality identify the most influential wallets within clusters, while community detection algorithms like Louvain method and Leiden algorithm automatically group related wallets based on transaction patterns.
Network topology metrics provide quantitative measures of cluster strength and coordination. Clustering coefficients measure how tightly connected cluster members are, path lengths reveal communication efficiency within clusters, and network density indicates coordination intensity. High clustering coefficients (above 0.7) combined with short average path lengths (below 3) typically indicate genuine coordinated clusters rather than coincidental similarities.
Machine learning clustering applies K-means, DBSCAN, and hierarchical clustering algorithms to transaction features like timing patterns, amount distributions, gas fee preferences, and contract interaction sequences. These algorithms can identify clusters that human analysis might miss while providing confidence scores for each cluster assignment.
Statistical validation ensures detected clusters represent genuine coordination rather than random patterns using null hypothesis testing and Monte Carlo simulations.
Transaction pattern vectorization converts wallet behavior into numerical features suitable for mathematical analysis.
Temporal feature extraction captures timing patterns including transaction frequency distributions, inter-transaction time intervals, time-of-day preferences, and day-of-week activity patterns. Coordinated wallets often show similar temporal signatures that distinguish them from independent retail traders.
Amount-based feature engineering analyzes transaction size distributions, round number preferences, gas fee patterns, and position sizing characteristics. Clusters often exhibit similar approaches to position sizing and risk management that create detectable statistical signatures.
Network interaction features examine contract interaction patterns, token preference similarities, DEX usage patterns, and protocol adoption sequences. Coordinated wallets typically interact with similar sets of contracts and protocols in predictable sequences.
Behavioral similarity scoring combines multiple feature vectors to calculate cosine similarity, Euclidean distance, and Jaccard similarity measures between wallet pairs. Similarity scores above 0.8 across multiple feature dimensions typically indicate cluster membership with high confidence.
Unsupervised clustering models identify wallet groups without predefined labels or training data.
DBSCAN clustering excels at finding clusters of varying sizes while identifying outlier wallets that don't belong to any cluster. Epsilon parameters can be tuned based on blockchain-specific transaction patterns, typically ranging from 0.1-0.3 for normalized feature vectors.
Hierarchical clustering creates dendrogram visualizations that show cluster formation at different similarity thresholds, helping identify both tight core clusters and looser affiliated groups. Agglomerative clustering builds clusters bottom-up by merging similar wallets, while divisive clustering splits large groups into subclusters.
Gaussian Mixture Models assume wallet behaviors follow multiple normal distributions, automatically determining the optimal number of clusters and providing probability assignments for cluster membership rather than hard classifications.
Network embedding methods like Node2Vec and GraphSAGE learn low-dimensional representations of wallet relationships that capture both local neighborhood structure and global network position, enabling more sophisticated clustering analysis.
Advanced cluster detection requires significant computational resources and statistical expertise but provides objective, reproducible, and statistically validated cluster identification that exceeds manual analysis capabilities. Tools like Wallet Finder.ai may incorporate some of these techniques, while custom implementations require machine learning and network analysis expertise.
Wallet clusters often display trading behaviors that can hint at market trends. These coordinated groups of wallets follow specific strategies that set them apart from individual retail traders, creating noticeable patterns when big market shifts are approaching. Let’s dive into these strategies and see how they differ from typical retail trading habits. Concepts like Position Sizing for Meme Tokens: Advanced Filters can further help traders refine their approach.
Wallet clusters are known for their synchronized trading moves, which leave clear footprints on the blockchain. Their strategies for entering and exiting positions are deliberate and calculated to maximize their impact.
One popular entry method is staggered accumulation. Instead of making large, attention-grabbing purchases, clusters distribute their buying activity across multiple wallets over a period. This tactic minimizes price disruptions. For instance, you might notice several wallets with similar transaction histories buying the same token within a short timeframe.
During high-volatility periods, another strategy called flash coordination comes into play. Here, several wallets execute trades within minutes, causing sudden spikes in trading volume. This often happens before major announcements or governance decisions, creating ripples in the market.
Exit strategies often mirror these entry tactics but are executed with more urgency. A common method is cascading liquidation, where one wallet tests the market by selling a small amount. If the price holds steady, the rest of the cluster follows suit, driving prices down rapidly.
Retail traders and wallet clusters behave quite differently in the market. Retail investors tend to react emotionally or impulsively to market news, while clusters act strategically, distributing their trades across multiple wallets to maintain balance.
Timing is another key difference. Retail traders often trade during regular business hours, while clusters prefer low-volume periods to make their moves, ensuring their actions have a greater impact on price discovery. Clusters also rely on systematic risk management strategies, like coordinated stop-losses or preset profit-taking levels, which can cause sudden market shifts when triggered.
Clusters also gain an edge by acting on information before it becomes public. For example, they may start accumulating tokens before positive news is announced, creating unusual trading patterns. Tools like Wallet Finder.ai help analysts spot these early signals, offering insights into cluster behavior.
Real-world examples highlight how wallet clusters influence the market. These strategies often play out in compelling ways:
Take the DeFi summer of 2020 as an example. Wallet clusters identified lucrative opportunities early, spread their investments across multiple addresses to maximize returns, and coordinated exits as market conditions changed. Similarly, cross-chain arbitrage showcases their sophistication, with clusters managing wallets across different blockchains to exploit price differences.
The article focuses on single-blockchain cluster analysis but misses how sophisticated wallet clusters operate across multiple blockchains to maximize opportunities and minimize detection. Cross-chain cluster coordination represents the evolution of institutional-level strategy implementation that exploits arbitrage opportunities, regulatory arbitrage, and liquidity fragmentation across different networks.
Multi-chain cluster identification requires analyzing wallet relationships across Ethereum, Binance Smart Chain, Polygon, Avalanche, Arbitrum, and other networks simultaneously. Clusters often maintain mirror wallet structures where similar addresses or deterministically generated addresses operate coordinated strategies across chains. Address derivation analysis can reveal wallets controlled by the same entity using similar private key generation or hardware wallet derivation paths.
Cross-chain arbitrage coordination shows clusters exploiting price differences between decentralized exchanges on different blockchains. Triangular arbitrage patterns involve simultaneous trades across three or more chains to capture price inefficiencies, while liquidity provision arbitrage places similar positions across multiple AMMs to maximize fee collection from cross-chain trading activity.
Bridge utilization patterns reveal cluster coordination through systematic cross-chain asset movement. Clusters often move assets between chains in coordinated waves before major market events, using staggered timing to avoid detection while maintaining strategic positioning. Bridge fee optimization shows clusters timing transfers during low-congestion periods and using batch bridging services to minimize costs.
Regulatory arbitrage strategies involve clusters moving assets to blockchains with favorable regulatory treatment or privacy features during uncertain regulatory periods. Migration pattern analysis can predict market sentiment by observing which blockchains receive increased cluster activity during different regulatory environments.
Synchronized liquidity provision across multiple chains indicates institutional-level coordination and often precedes major market movements.
Multi-DEX positioning patterns show clusters providing liquidity to Uniswap, SushiSwap, PancakeSwap, QuickSwap, and other DEXs simultaneously. Liquidity ratio analysis reveals whether clusters are market making for profit or strategically positioning for upcoming announcements or token launches.
Cross-chain yield farming coordination demonstrates sophisticated risk management and opportunity optimization. Clusters often diversify single farming strategies across multiple chains to reduce smart contract risk while maintaining similar risk-return profiles. APY arbitrage patterns show clusters moving between chains chasing higher yields with coordinated timing.
Multi-chain governance participation reveals clusters using distributed voting power across different blockchain governance systems. Proposal coordination analysis can identify clusters that vote similarly across multiple DAOs and protocols, indicating shared information sources or coordinated decision-making.
Cross-chain MEV exploitation shows advanced clusters coordinating maximum extractable value strategies across multiple blockchains simultaneously. Flash loan arbitrage, liquidation coordination, and sandwich attack patterns often span multiple networks when executed by sophisticated clusters.
Bridge transaction correlation analysis identifies related wallet activities across different blockchain networks.
Bridge timing analysis reveals coordinated cross-chain movements by examining transaction timestamps across multiple bridge protocols. Statistical clustering of bridge usage times can identify wallets that consistently bridge assets within similar time windows, suggesting coordination.
Bridge route optimization shows clusters selecting cost-efficient pathways between chains using intermediate bridge networks or multi-hop strategies to minimize fees and transaction times. Route selection patterns often reveal shared optimization algorithms or information sources.
Cross-chain balance correlation tracks how wallet balances across different chains move in synchronized patterns. Portfolio rebalancing across chains often indicates institutional-level risk management and strategic asset allocation that precedes major market moves.
Bridge liquidity impact analysis examines how cluster movements affect bridge token reserves and cross-chain price stability. Large coordinated bridge usage can create temporary arbitrage opportunities or cross-chain price disparities that indicate upcoming market volatility.
Cross-chain cluster analysis requires multi-blockchain data infrastructure and sophisticated correlation analysis but provides insights into the most advanced institutional trading strategies that single-chain analysis cannot detect. This represents the frontier of wallet cluster analysis for predicting major market movements and understanding institutional positioning.
Looking at wallet clusters over time reveals fascinating insights into market behavior. By observing how these groups adjust their strategies during different phases, we can uncover potential shifts in the market. Their actions often align with broader trends, offering a deeper understanding of how markets evolve.
Wallet clusters tend to follow the rhythm of the market. During bull markets, they focus on gradual accumulation, often targeting tokens with strong fundamentals. In contrast, bear markets push clusters toward contrarian moves, like buying assets others are selling, moving into stablecoins, or seeking yield through staking and liquidity provision. When markets move sideways, clusters take advantage of arbitrage opportunities and reposition their portfolios for upcoming changes. Interestingly, their trading strategies adapt to the momentum - either blending with rising markets or maximizing price impact during quieter, declining periods.
Clusters can act as early warning signs for changing market sentiment. For instance, a wave of staking activity often signals growing bullish confidence. On the other hand, coordinated withdrawals from DeFi protocols or unstaking tokens might point to preparations for increased volatility. Cross-chain asset movements also provide hints about sentiment or risk management strategies. For example, shifting from riskier altcoins to more established cryptocurrencies like Bitcoin or Ethereum often reflects a defensive stance, especially before anticipated market corrections. These behaviors give traders clues about the market's direction.
Studying historical patterns of wallet clusters adds another layer to understanding market trends. By looking at their past strategies, traders can identify recurring behaviors that often signal future movements. For example, clusters tend to rebalance around key events like economic updates, protocol upgrades, or regulatory changes. Before making large moves, they may test the waters with smaller "probe" transactions to gauge market liquidity. Over time, clusters alternate between periods of intense activity and quieter phases. Tools like Wallet Finder.ai make it easier to track these patterns, offering real-time alerts when current behaviors mirror past trends that led to significant market shifts.
Wallet Finder.ai simplifies wallet cluster analysis by offering tools that identify coordinated movements often linked to market shifts. It works seamlessly with earlier analytical methods, delivering practical insights to enhance your strategies.
Wallet Finder.ai’s Discover Wallets feature is designed to pinpoint high-performing wallet clusters using advanced filtering options. You can filter wallets based on profitability, win streaks, and consistency - factors that often signal coordinated trading strategies. This tool focuses on groups that take similar actions, such as entering and exiting positions around the same time or targeting related tokens. Filters like portfolio size, trading frequency, and asset preferences let you refine your search even further.
The platform also provides detailed profit and loss statistics, helping you assess the historical performance and effectiveness of specific clusters. To make tracking easier, you can create custom watchlists. For example, you might group wallets into categories like DeFi yield farming clusters, arbitrage-focused groups, or long-term accumulation strategies. These watchlists make it easier to spot changes in behavior or strategy.
Wallet Finder.ai includes visual tools like graphs and charts to showcase how wallet clusters evolve their strategies over time. These visuals help you see how clusters adapt to different market conditions, whether it’s during a bull run, a bear market, or periods of low activity.
For deeper analysis, you can export data to examine transaction histories, position sizes, and timing details offline. This allows you to perform custom calculations and uncover patterns of coordination. By analyzing how wallets allocate positions, you might identify shared decision-making or common sources of information driving their strategies.
The platform’s Telegram alert system keeps you updated on important wallet activities. You can set alerts for large transactions, new positions, or coordinated movements, helping you stay informed about rapid market changes and act quickly on opportunities.
You can also connect your wallet to compare its performance against successful clusters, giving you a clearer picture of strategic gaps or areas for improvement. Custom analytics tools are particularly useful for tracking how different types of clusters - like those focused on yield farming, arbitrage, or long-term holding - perform under various market scenarios. Wallet Finder.ai’s filtering and analysis features help you identify the best-performing clusters for specific conditions, enabling you to fine-tune your strategies as the market evolves.
The article treats cluster wallets as equals, but sophisticated cluster analysis reveals hierarchical structures where lead wallets make decisions that follower wallets replicate with predictable time delays. Influence propagation modeling identifies decision-makers, early adopters, and followers within clusters, providing precise timing advantages for anticipating market movements based on leadership wallet activity.
Hierarchy detection algorithms analyze transaction timing sequences to identify which wallets consistently act first within coordinated movements. Lead wallets typically execute initial positioning 2-12 hours before follower wallets begin replication. Time-lag correlation analysis measures these delays and identifies influence relationships with statistical significance testing.
Information cascade modeling tracks how trading decisions flow through cluster networks from information sources to final execution wallets. Multi-tier structures often include intelligence gathering wallets (that interact with information sources), decision-making wallets (that determine strategy implementation), and execution wallets (that implement strategies with position scaling).
Influence strength quantification uses network centrality measures and decision replication ratios to rank wallet importance within clusters. High-influence wallets show follower replication rates above 80% within 24 hours, while low-influence wallets primarily follow other cluster members without initiating new strategies.
Strategic role identification categorizes cluster wallets based on their function: scouts (early opportunity identification), validators (strategy testing with small positions), amplifiers (scaling successful strategies), and stabilizers (providing exit liquidity during profit-taking phases).
Directed graph analysis treats wallet interactions as directed edges showing information flow direction and influence propagation pathways.
PageRank algorithm adaptation for wallet networks identifies authoritative wallets whose actions carry disproportionate influence within clusters. High PageRank scores indicate wallets that consistently influence network-wide strategy changes rather than simply participating in existing trends.
Influence propagation timing measures decision cascade speed through cluster networks. Fast propagation (full cluster activation within 2-6 hours) indicates strong coordination and urgent positioning. Slow propagation (activation over 24-48 hours) suggests strategic accumulation or risk-managed positioning.
Network resilience analysis examines how cluster coordination changes when key influence nodes become inactive or change behavior. Resilient clusters maintain coordination despite individual wallet changes, while fragile clusters dissolve when lead wallets exit or modify strategies.
Cross-cluster influence modeling identifies bridge wallets that participate in multiple cluster networks and can propagate information or strategies between different institutional groups. These inter-cluster connectors often provide early signals when multiple institutional groups begin coordinated positioning.
Strategy origination tracking identifies wallet addresses that consistently initiate new strategies before cluster-wide adoption.
Origination wallet identification focuses monitoring resources on high-value intelligence sources rather than attempting to track all cluster members. Strategy origination rates above 60% (where a wallet initiates strategies that the cluster later adopts) indicate prime intelligence targets for early signal detection.
Replication delay modeling quantifies expected time windows between lead wallet actions and follower wallet replication. Tier-1 followers typically replicate within 2-8 hours, Tier-2 followers within 8-24 hours, and Tier-3 followers within 24-72 hours. Understanding these delays enables optimal entry timing between lead signals and broad cluster adoption.
Decision confidence indicators analyze how replication ratios and replication speed correlate with subsequent strategy success. High-confidence decisions show >90% follower adoption within 12 hours, while uncertain decisions show <60% adoption with extended replication periods.
False signal filtering distinguishes between genuine strategy initiations and routine portfolio management or opportunistic trades by analyzing follower response patterns and position size scaling.
Real-time influence tracking monitors decision propagation as it occurs, enabling immediate positioning based on lead wallet activity.
Network visualization dashboards display cluster hierarchies, influence strengths, and decision flow patterns in intuitive graphical formats. Node size represents influence strength, edge thickness shows replication consistency, and edge direction indicates information flow.
Influence change detection identifies when cluster hierarchies shift, indicating changing institutional leadership or evolving strategy focus. Leadership transitions often precede major strategy shifts and market positioning changes.
Alert prioritization systems weight notifications based on wallet influence rankings rather than transaction sizes or basic activity metrics. Lead wallet alerts receive highest priority, Tier-1 follower alerts provide confirmation signals, and Tier-2+ follower alerts indicate strategy momentum.
Performance attribution analysis tracks how lead wallet decisions translate into cluster-wide performance and market impact, validating influence mapping accuracy and hierarchy stability.
Cluster hierarchy analysis represents advanced institutional intelligence that provides significant timing advantages but requires sophisticated network analysis capabilities and comprehensive cluster identification. Most manual analysis approaches cannot effectively implement these techniques, making specialized tools and automated systems essential for professional-grade cluster influence tracking.
Wallet cluster analysis plays a key role in helping traders predict changes in the DeFi market up to 48 hours before they happen. By observing how groups of wallets act in unison, you can uncover patterns that hint at major market moves before they’re widely recognized.
The methods outlined here - like tracking coordinated movements and studying market phases - provide a solid approach to spotting potential profit opportunities. Metrics such as entry and exit points, position sizing, and timing patterns reveal the strategies behind successful wallet clusters. This helps you separate random retail activity from deliberate, coordinated actions.
These insights become even more powerful when paired with advanced tracking tools. For instance, Wallet Finder.ai simplifies this complex analysis, turning it into actionable insights. The platform offers real-time alerts whenever top-performing traders make new moves, giving you a chance to act on opportunities ahead of the crowd.
By combining historical data with real-time monitoring, you can break down the strategies of consistently successful wallets. This includes understanding their entry points, exits, position sizes, and timing - key factors that have driven their success.
As the DeFi market evolves, staying ahead will depend on your ability to identify and interpret these wallet cluster trends. Mastering this analysis and using tools like Wallet Finder.ai can give traders a significant edge in anticipating market shifts and sharpening their strategies.
Wallet cluster analysis lets traders keep an eye on groups of wallets managed by the same entity, like big investors or institutions. By tracking these clusters, traders can spot important actions like fund accumulation or distribution, which might hint at upcoming market changes.
This kind of analysis helps traders predict major price shifts and adjust their strategies based on solid data. Recognizing patterns in wallet activity gives traders a chance to stay ahead of trends and make smarter, more informed choices.
Wallet Finder.ai offers real-time alerts and advanced filtering tools designed to help users keep tabs on wallet clusters and spot meaningful trading patterns. With these features, users can easily track connected wallets, dive into their activity, and pinpoint emerging market trends with ease.
Wallet clusters stand apart from individual retail traders because they usually represent large, organized players like institutional investors or crypto exchanges, rather than single users. These clusters often handle big transactions and spread assets across multiple wallets to maintain privacy, making their actions more calculated and less influenced by short-term market swings.
Studying wallet clusters can reveal patterns such as whale activity or institutional trades that might indicate upcoming market shifts. This kind of analysis can sharpen trading strategies by helping traders predict major price changes and adjust their positions ahead of time. Grasping these patterns can give retail traders an edge in understanding and navigating broader market trends.
Advanced cluster detection uses graph theory and machine learning algorithms to systematically identify coordinated wallet behavior beyond manual pattern recognition. Graph-based analysis treats blockchain addresses as nodes and transactions as edges, applying centrality measures like betweenness centrality and eigenvector centrality to identify influential wallets within networks. Community detection algorithms like Louvain method and Leiden algorithm automatically group related wallets based on transaction patterns. Network topology metrics provide quantitative validation: clustering coefficients above 0.7 combined with average path lengths below 3 typically indicate genuine coordination rather than coincidental similarities. Machine learning clustering applies K-means, DBSCAN, and hierarchical clustering to transaction features including timing patterns, amount distributions, gas fee preferences, and contract interaction sequences. Feature engineering converts wallet behavior into numerical vectors measuring temporal signatures, behavioral similarities, and network interactions. Statistical validation uses null hypothesis testing and Monte Carlo simulations to ensure detected clusters represent genuine coordination rather than random patterns. Similarity scores above 0.8 across multiple feature dimensions typically indicate cluster membership with high confidence, while DBSCAN epsilon parameters of 0.1-0.3 work well for normalized blockchain feature vectors.
Cross-chain cluster coordination represents institutional-level strategy implementation exploiting opportunities across Ethereum, BSC, Polygon, Avalanche, and other networks simultaneously. Mirror wallet structures maintain similar addresses or deterministically generated addresses operating coordinated strategies across chains, detectable through address derivation analysis. Cross-chain arbitrage coordination shows clusters exploiting price differences through triangular arbitrage patterns involving simultaneous trades across three or more chains, and liquidity provision arbitrage placing similar positions across multiple AMMs. Bridge utilization patterns reveal systematic cross-chain asset movement in coordinated waves before major market events, using staggered timing and batch bridging services for cost optimization. Regulatory arbitrage strategies involve moving assets to blockchains with favorable regulatory treatment during uncertain periods. Multi-DEX positioning shows clusters providing liquidity to Uniswap, SushiSwap, PancakeSwap simultaneously for market making or strategic positioning. Cross-chain yield farming demonstrates risk management by diversifying single strategies across multiple chains, while multi-chain governance participation uses distributed voting power across different DAOs. Cross-chain MEV exploitation coordinates flash loan arbitrage, liquidation strategies, and sandwich attacks spanning multiple networks for sophisticated institutional-level profit extraction.
Temporal clustering analysis tracks how wallet coordination forms, dissolves, and reforms in response to market cycles and events, providing reliable market shift predictions. Cluster lifecycle tracking shows formation phases beginning 2-4 weeks before major events with gradually increasing transaction correlation and timing synchronization, peak coordination during volatility periods, and dissolution as conditions stabilize. Market cycle synchronization reveals cluster formation accelerating during transition periods: bull-to-bear transitions show defensive positioning clusters, bear-to-bull transitions show accumulation coordination, while sideways markets show minimal formation except around specific opportunities. Dynamic correlation tracking uses rolling correlation windows and breakpoint detection to measure relationship changes. Cluster cohesion metrics quantify coordination strength: scores above 0.75 indicate strong coordination, below 0.3 suggests dissolution. Formation velocity analysis distinguishes rapid formation (1-2 weeks, indicating event-driven positioning) from gradual formation (1-2 months, suggesting strategic long-term positioning). Predictive modeling uses lead-lag analysis showing event-driven formation typically begins 10-21 days before announcements, while seasonal patterns reveal Q4 clustering for tax optimization and Q1 clustering for new opportunities. Cross-market correlation between VIX spikes and DeFi cluster formation often exceeds 0.6 during uncertainty, enabling market-driven formation prediction.
Cluster hierarchy analysis reveals decision-making networks where lead wallets initiate strategies that follower wallets replicate with predictable time delays. Hierarchy detection algorithms analyze transaction timing sequences to identify wallets consistently acting first - lead wallets typically execute initial positioning 2-12 hours before follower wallet replication. Time-lag correlation analysis measures these delays with statistical significance testing. Information cascade modeling tracks decision flow from intelligence gathering wallets (interacting with information sources) to decision-making wallets (determining strategy) to execution wallets (implementing with position scaling). Influence strength quantification uses network centrality measures and decision replication ratios - high-influence wallets show follower replication rates above 80% within 24 hours. PageRank algorithm adaptation identifies authoritative wallets with disproportionate influence over network-wide strategy changes. Strategy origination tracking identifies wallets with origination rates above 60% (initiating strategies the cluster later adopts) as prime intelligence targets. Replication delay modeling shows Tier-1 followers replicate within 2-8 hours, Tier-2 within 8-24 hours, Tier-3 within 24-72 hours. Decision confidence indicators analyze how replication ratios and speed correlate with subsequent success: high-confidence decisions show >90% follower adoption within 12 hours, while uncertain decisions show <60% adoption with extended periods. Focus monitoring on lead wallets for early signal detection rather than tracking all cluster members.

A premier DeFi analytics platform empowering traders to discover and analyze profitable blockchain wallets, trades and tokens.