
Best Crypto Indicators for Trading in 2026
Discover the 10 best indicators for crypto trading in 2026. Learn to combine technical, on-chain, and sentiment metrics for a winning edge.
Navigating the volatile crypto market requires more than just intuition. The difference between profit and loss often comes down to the quality of your signals and the ability to interpret them correctly. While countless indicators exist, only a select few offer a genuine edge by revealing what smart money is doing behind the scenes. This guide cuts through the noise to deliver a definitive roundup of the best indicators for crypto, combining timeless technical analysis with powerful on-chain metrics.
We’ll move beyond basic price action to explore a multi-faceted approach to market analysis. You will learn how to interpret signals from both classic tools and modern data sources, giving you a more complete picture of market dynamics. This isn't just a list of definitions; it's a practical playbook for identifying high-probability setups.
Each section will break down a specific indicator, covering:
- What it is: A direct explanation of how the indicator works.
- Pros and Cons: Strengths and weaknesses specific to the crypto markets.
- Actionable Setups: Concrete examples of how to use the signals for entries and exits.
Most importantly, we'll show you how to synthesize this information. We will detail how to combine these indicators into a powerful workflow, using tools like Wallet Finder.ai to not just spot opportunities, but to validate them with real whale wallet activity. The goal is to equip you with a system for making data-driven decisions before the rest of the market catches on, giving you a tangible advantage in your trading.
1. Moving Average Convergence Divergence (MACD)
The Moving Average Convergence Divergence (MACD) is a classic momentum oscillator that has remained one of the best indicators for crypto due to its reliability in identifying trend direction and strength. It operates by measuring the relationship between two exponential moving averages (EMAs), typically the 12-period and 26-period EMAs. This calculation creates the "MACD line." A nine-period EMA of the MACD line, known as the "signal line," is then plotted over it, generating clear trading signals.
The histogram, the third component, represents the distance between the MACD and signal lines. When the MACD line crosses above the signal line, it suggests upward momentum is building (a bullish signal). Conversely, a cross below indicates bearish momentum.
Actionable Setups and Examples
- Bullish Crossover: When the MACD line crosses above the signal line, it signals a potential buying opportunity. This is often strongest when it occurs below the zero line, indicating a potential reversal from a downtrend.
- Bearish Crossover: A MACD line crossing below the signal line suggests it might be time to sell or short an asset. This signal gains strength when it happens above the zero line.
- Histogram Divergence: A powerful signal occurs when the price makes a new high, but the MACD histogram forms a lower high. This bearish divergence signals that the underlying momentum is weakening and a price reversal could be imminent.
For instance, a trader might notice the MACD crossing bullishly for a Solana token. To validate this, they could use a tool like Wallet Finder.ai to see if top-performing Solana wallets are accumulating at the same time, adding a layer of on-chain confirmation to the technical signal. If you're new to technicals, understanding how to read crypto charts is a foundational skill.
Key Insight: The histogram is more than just a visual aid; its size reflects momentum. A growing histogram indicates an accelerating trend, while a shrinking one signals that the trend is losing steam, often preceding a crossover.
Combining MACD signals with other indicators, like the Relative Strength Index (RSI), can filter out false signals and produce a more robust trading strategy.
2. Relative Strength Index (RSI)
The Relative Strength Index (RSI) is a staple momentum indicator that measures the speed and magnitude of recent price movements. It evaluates overbought and oversold conditions on a scale of 0 to 100, making it one of the best indicators for crypto traders to gauge market extremes. Developed by J. Welles Wilder Jr., this tool helps identify potential price reversals with impressive reliability.
An asset is generally considered overbought when its RSI value rises above 70, suggesting that a bullish run may be losing strength and a correction is possible. Conversely, an RSI below 30 indicates an oversold condition, signaling that bearish pressure could be exhausted and a price bounce may be on the horizon.
Actionable Setups and Examples
- Oversold Entry: A classic buy signal occurs when an asset's RSI drops below 30 and then crosses back above it. This suggests the sell-off has reached its limit and buyers are stepping back in.
- Overbought Exit: When an asset's RSI climbs above 70, it signals that the market is overheated. A cross back below 70 can be a strong indication to take profits or consider a short position.
- Bullish Divergence: This powerful setup appears when the price makes a new low, but the RSI forms a higher low. This discrepancy signals that downside momentum is fading, often preceding a significant price reversal to the upside.
For example, a trader might see an altcoin's RSI dip to 25 while simultaneously using a tool like Wallet Finder.ai to observe that top-performing wallets are accumulating heavily. This on-chain confirmation of whale buying during a technically oversold period provides a high-conviction entry signal, suggesting a bottom is forming.
Key Insight: Don't just watch the 70/30 levels. The 50-level acts as a key battleground. In a strong uptrend, RSI will often find support at or above 50, while in a downtrend, it will face resistance there. A cross of the 50-level can confirm a shift in the primary trend.
Combining RSI with volume analysis can add another layer of confirmation. A move out of oversold territory on high volume is a much stronger signal than one on low volume.
3. On-Chain Volume and Exchange Flows
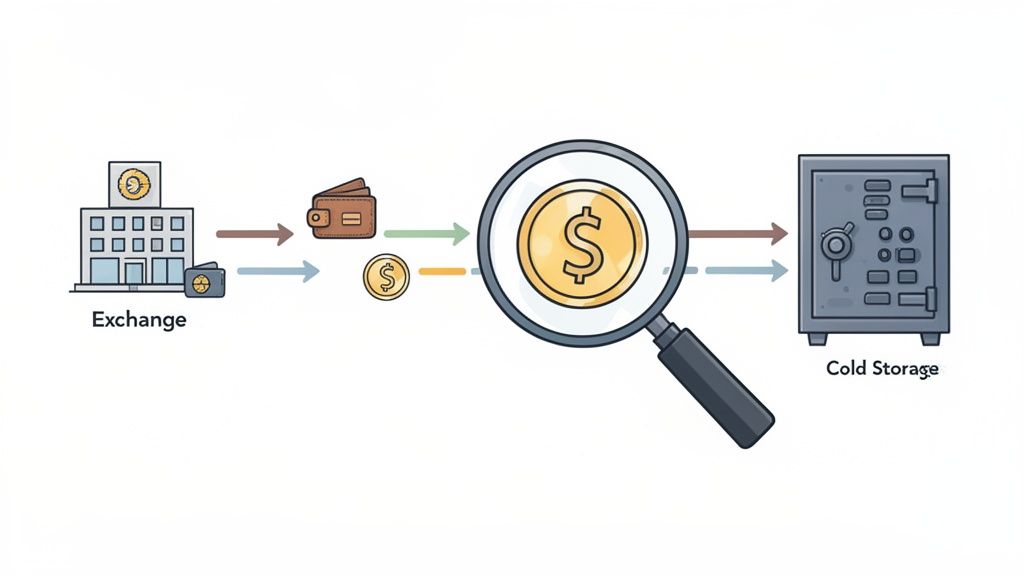
On-chain volume is one of the best indicators for crypto because it tracks the actual movement of assets between wallets, separating it from speculative exchange trading volume. This metric offers a transparent view into whether smart money is accumulating assets by moving them to cold storage or preparing to sell by sending them to exchanges. Analyzing these flows reveals real capital decisions, providing a powerful edge.
Start tracking smart money today
Join thousands of traders using WalletFinder.ai to find profitable wallets and copy their trades.
Start Free Trial →

