
Edge Crypto Price: A Trader's 2026 Guide
Get a complete analysis of the Edge crypto price in 2026. Understand historical trends, key drivers, and how to use Wallet Finder.ai to trade EDGE.
You search Edge crypto price, open three tabs, and get three different answers. One screen shows a live-looking quote, another shows barely any volume, and a third makes the token look more liquid than it probably is. This is a significant problem with trading smaller assets. The chart is only part of the job. The harder part is deciding whether the price you're seeing is genuinely tradeable.
With Definitive (EDGE), that confusion matters more than usual. This isn't the kind of token where you can glance at one aggregator, place a market order, and assume the tape is telling the full story. Venue coverage looks fragmented, reported liquidity can vary sharply, and short-term moves can come from order flow and breakout dynamics more than broad market trend.
If you're evaluating the Edge crypto price as a trader, the useful question isn't just “what is EDGE trading at?” It's “where is that price coming from, how much real volume is behind it, and what would execution look like if I enter now?”
Untangling the Edge Crypto Price Puzzle
Most searches for Edge crypto price are really searches for Definitive (EDGE), not a generic token named “edge.” That sounds minor, but it creates a practical problem fast. Traders end up mixing data from different pages, different tickers, and different exchanges, then wonder why the numbers don't line up.
The bigger issue is fragmented liquidity. CoinMarketCap's Definitive page shows EDGE around $0.079 with $3.68M in 24-hour volume, while Coinbase and Binance show prices around $0.08 to $0.10, and Binance reports $0 market cap plus only $1,030 in 24-hour volume, according to CoinMarketCap's Definitive market page. That kind of mismatch tells you the simple spot quote is not enough.
Why this happens
For low-liquidity tokens, the “market price” is often an aggregate abstraction, not a clean executable level. Different venues can have different books, different participant bases, and different update quality. One exchange might show a move that looks meaningful on a chart, while another shows almost no trading behind it.
That creates two separate markets:
- The displayed market where price pages publish a quote
- The executable market where your order gets filled
Practical rule: On small-cap tokens, treat every quoted price as a starting point, not a conclusion.
What traders should do first
Before reading momentum into any EDGE move, check these basics:
- Confirm the token identity: Make sure the page refers to Definitive (EDGE), not another similarly named asset.
- Compare venue quotes: If major platforms disagree materially, assume liquidity is patchy.
- Check whether the move is actionable: A green candle without dependable volume context can be noise.
- Estimate position realism: If the venue is thin, your planned size may move the book against you.
If you need a quick framework for translating token supply and price into something more usable, this guide on how to calculate coin value is a useful companion to the execution side of the puzzle.
What Definitive (EDGE) Actually Is
Before reading any chart or liquidity table, it helps to know what the token is actually attached to, since that context shapes which price moves are fundamentally meaningful and which are pure trading noise.
Definitive is a cross-chain, non-custodial trading terminal that aggregates liquidity across more than 100 decentralized exchanges spanning Ethereum, Solana, Base, and several other EVM chains. Its core pitch to traders is bringing centralized-exchange-style tools, limit orders, stop-losses, and time-weighted average price execution, to on-chain trading, along with gas abstraction that lets users trade across chains without manually bridging assets between them. EDGE is the platform's native utility token, with a fixed total supply of one billion tokens on Base.
The token's stated utility centers on staking. Users who stake EDGE receive reduced trading fees on the platform, and the protocol directs a share of its trading revenue toward EDGE buybacks and staker rewards, meaning the token's value is at least partly tied to actual platform trading volume rather than pure speculation. That distinction matters for how you interpret price action. A move driven by rising platform volume and buyback activity reflects something different than a move driven purely by exchange listing hype or broad altcoin sentiment, even though both can look identical on a price chart in the short term.
Reading the Current EDGE Price Chart
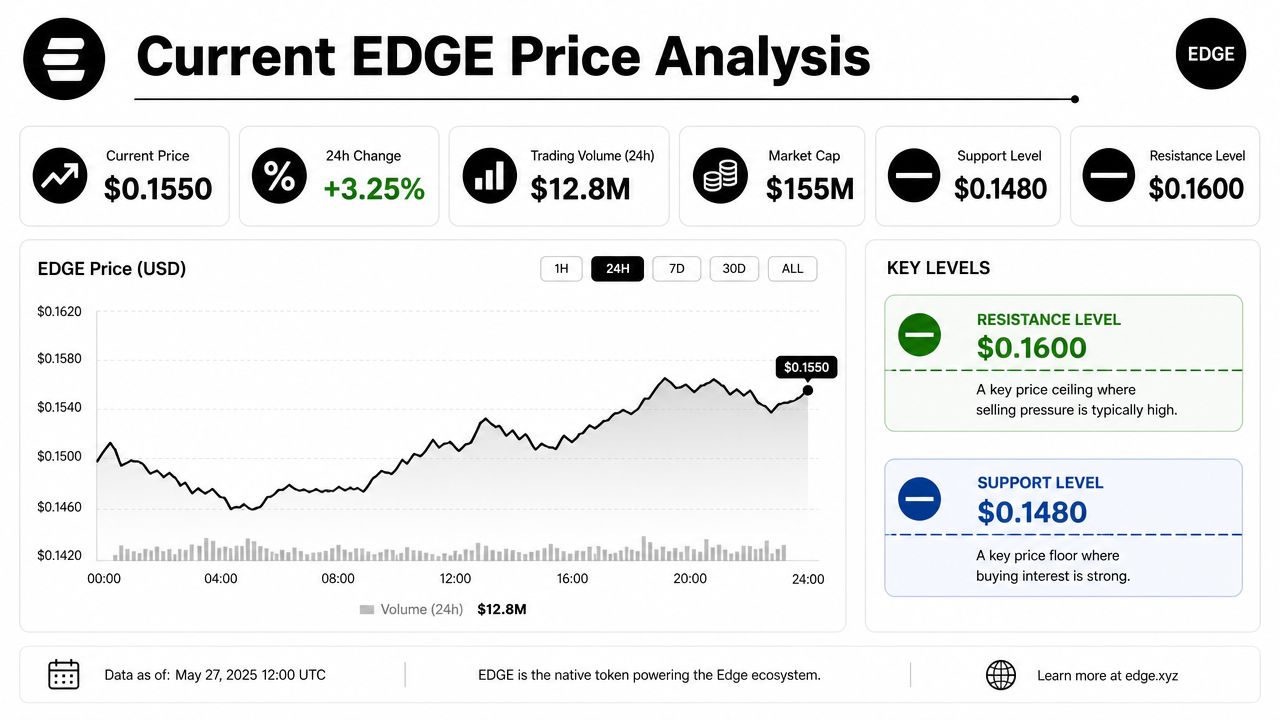
The current EDGE chart is more useful when you stop asking whether it's bullish or bearish in absolute terms and start asking whether it's tradable. On independent technical dashboards, EDGE is currently classified as neutral, with a 14-day RSI of 54.335 near the midpoint. Key pivot-based support levels sit at $0.08982 and $0.08826, while resistance sits at $0.09315 and $0.09491, according to Investing.com's Definitive technical page.
Start tracking smart money today
Join thousands of traders using WalletFinder.ai to find profitable wallets and copy their trades.
Start Free Trial →

