
Top Crypto Bubble App Tools for Traders
Discover the best crypto bubble app for 2026. This guide details 12 essential tools to spot market risks, track whale wallets, and protect your portfolio.
In the fast-paced world of digital assets, staying ahead of market bubbles isn't just an advantage; it's a necessity for survival. Extreme volatility can erase gains in minutes, and telling the difference between sustainable growth and speculative mania is the key to protecting your portfolio. This guide cuts through the noise to deliver the definitive roundup of the best crypto bubble app tools designed for this exact purpose.
We will move beyond simple price charts to explore a curated selection of sophisticated platforms. These tools offer everything from deep on-chain intelligence and wallet tracking to real-time sentiment analysis and liquidation alerts. Whether you're a DeFi copy trader mirroring top wallets, a quant researcher analyzing market structure, or a retail investor trying to avoid the next major downturn, these resources provide the actionable data needed to navigate complex market cycles.
Each entry in our list includes a detailed breakdown with screenshots, direct links, ideal user profiles, and practical workflows. We'll analyze the core signals each platform uses, discuss its pros and cons, and show you how to integrate its alerts for timely action. This list is your blueprint for finding the right crypto bubble app to identify over-leveraged positions and make informed decisions before a potential bubble pops. Let's dive into the essential tools that can give you a critical edge in today's crypto landscape.
The Hidden Limitations of Bubble Visualizations (What the Charts Don't Tell You)
Bubble charts are visually compelling. They make complex market data instantly digestible. But this simplicity comes with a cost: they can create a dangerous illusion of understanding while hiding critical context that separates profitable trades from expensive mistakes.
Most traders treat bubble apps as if they're showing objective truth. A massive green bubble means "strong performance," so it must be a good buy, right? Wrong. These tools visualize what happened, not why it happened or what happens next. Understanding their blind spots is what separates informed use from reckless gambling.
The Recency Bias Trap
Bubble charts prioritize recent performance (1-hour, 1-day, 1-week). This creates a cognitive bias where traders assume current momentum will continue indefinitely. You see a coin pumping 300% in 24 hours, displayed as a giant green bubble. Your brain screams "buy!"
The reality: you're looking at the end of the pump, not the beginning. By the time a token appears as a massive green bubble on your screen, thousands of traders have already spotted it. The early money has exited. You're buying the top.
Real example: A memecoin pumps 400% overnight. It dominates your bubble chart. You buy in immediately. Within 2 hours, it crashes 60% as whales dump on retail FOMO. The bubble chart showed you the peak, not the opportunity.
Protection strategy: Never buy based on bubble size alone. Use the bubble chart to discover outliers, then immediately pivot to:
- On-chain analysis: Who's buying? Whales or retail?
- Volume profile: Is volume increasing or declining?
- Holder distribution: Is supply concentrated or distributed?
The bubble shows you what moved. Other tools show you if it's sustainable.
The Missing Context Problem
Bubble charts show market cap and performance but strip away everything else. You see a coin is up 50%, but you don't see:
- Why it's up: Major exchange listing? Partnership? Pump-and-dump scheme?
- Trading infrastructure: Is there liquidity to exit? What's the slippage?
- Holder behavior: Are whales accumulating or distributing?
- Broader context: Is this an outlier or part of a sector-wide rally?
Case study: A DeFi token shows +200% in green. Looks incredible. The missing context: the pump was driven by a single whale manipulating a low-liquidity pool. Total liquidity: $50K. You can't sell your position without 40% slippage. The bubble chart made it look like an opportunity. It was a trap.
Solution: Build a two-step workflow:
- Bubble chart = discovery engine: Spot unusual moves
- Verification layer = decision engine: Use Bubblemaps (holder distribution), DEXScreener (liquidity), and Wallet Finder (whale tracking) to verify if it's real
The bubble gets you interested. The verification tools decide if you trade.
The Survivorship Bias Illusion
Bubble charts only show coins that still exist and have liquidity. They don't show the 90% of tokens that rugged, went to zero, or lost all liquidity. This creates a false sense of market stability.
You're seeing "the 100 best performers today" without seeing the 1,000 tokens that completely imploded. This warps your perception of risk. The market looks safer than it is because you're only seeing survivors.
Impact on strategy: Traders who rely solely on bubble charts underestimate tail risk. They assume volatility is the main risk (price going down), ignoring catastrophic risk (liquidity vanishing, rug pulls, exchange delistings).
Risk management: Treat bubble charts as a curated highlight reel, not a complete picture. Any token you trade based on bubble chart discovery should have:
- Verified smart contract (not a honeypot)
- Distributed holder base (use Bubblemaps)
- Adequate liquidity (minimum $100K for safe exits)
- Time-tested history (not a 3-day-old token)
1. Wallet Finder.ai
Best For: Real-time on-chain intelligence and copy trading.
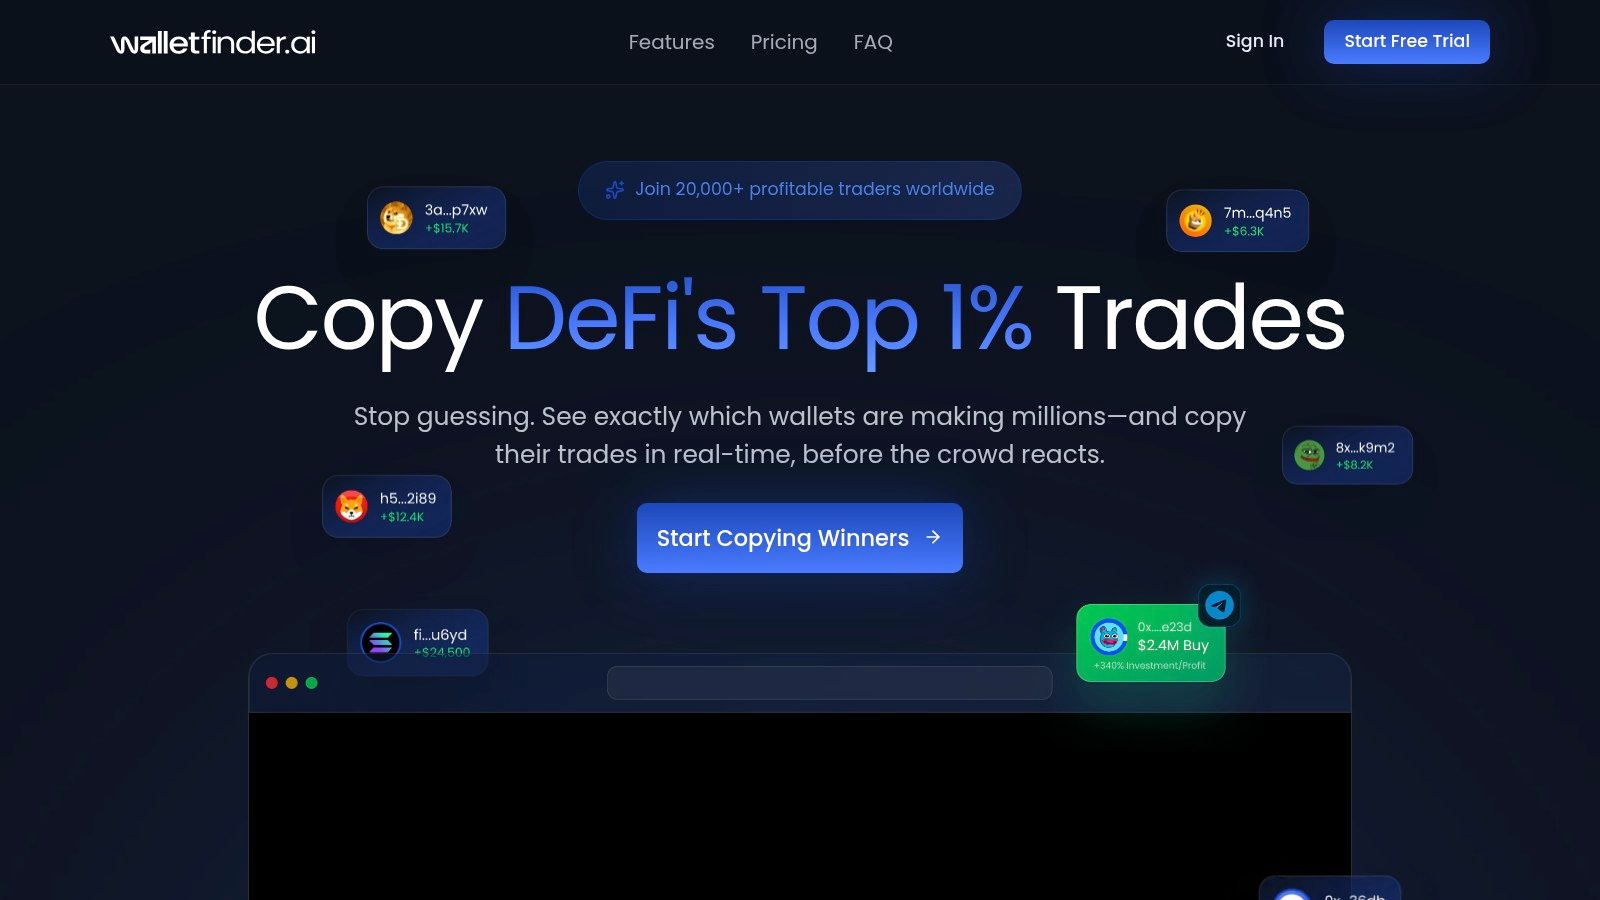
Wallet Finder.ai establishes itself as a premier platform for traders aiming to leverage on-chain data for a competitive edge. It transforms the overwhelming noise of blockchain transactions into a curated stream of actionable signals, making it an indispensable tool for identifying market-moving wallets and emerging token trends before they hit the mainstream. This platform is meticulously designed for those who believe the most profitable alpha is found by analyzing the actions of top-performing traders directly on the blockchain.
At its core, Wallet Finder.ai functions as a sophisticated "smart money" tracker. It allows users to dissect the performance of millions of wallets across major chains like Ethereum, Solana, and Base. By aggregating and analyzing PnL, win rates, and complete trade histories, it moves beyond simple whale watching. It provides a quantifiable framework for discovering traders with verifiable track records, which is crucial for anyone looking to build a data-driven strategy. This capability makes it a powerful crypto bubble app, as it can surface wallets that are consistently early to explosive, high-risk, high-reward plays often seen in speculative market phases.
Start tracking smart money today
Join thousands of traders using WalletFinder.ai to find profitable wallets and copy their trades.
Start Free Trial →

