
Chain Trade Size Chart: Spot Smart Money Moves
Master the on-chain trade size chart to analyze market structure and copy trade with precision. Learn to build and read charts with Wallet Finder.ai.
You're probably staring at a token that just printed a clean volume spike. Candles look alive. Feeds are getting louder. A few wallets you recognize have touched it, but you still can't answer the only question that matters before entry.
Who is behind the move?
That's where most traders stay blind. A basic volume chart tells you activity increased. It doesn't tell you whether that activity came from scattered retail buys, a cluster of repeat midsize entries, or a few large wallets building size with intent. If you're trying to mirror profitable wallets instead of chasing delayed narratives, that gap matters.
A Chain Trade Size Chart fixes that. Instead of treating all volume as equal, it breaks flow into trade-size buckets and tracks how those buckets behave over time. Done properly, it gives you a cleaner read on participation quality, pressure, and timing. It also helps you separate noise from positioning, which is the difference between reacting late and moving with the wallets that usually get there first.
Beyond Volume Why Trade Size Distribution Matters
A lot of traders have the same failure mode. They see volume expand, check a few wallets, notice green candles, then convince themselves the move is institutional. Sometimes it is. Often it isn't.
A token can print heavy activity for bad reasons. Airdrop farmers can rotate through it. Small wallets can pile in after a social spike. Bots can hammer a low-liquidity pair and make the tape look more important than it is. If you only watch raw volume, all of that gets compressed into one blunt signal.
Why plain volume stops helping
Volume is broad. Trade size distribution is specific.
If a chart shows rising activity but nearly all of it sits in the smallest buckets, you're usually looking at crowd participation, speculation, or reactive flow. If larger buckets start appearing repeatedly while price stays relatively contained, that's a very different setup. You're no longer asking whether the market is active. You're asking which class of participant is active.
That distinction matters more than is commonly acknowledged.
Practical rule: A volume spike without trade-size context is just motion. It's not positioning.
This is also where many traders misuse wallet tracking. They copy a known wallet after it buys, but they don't check whether that buy happened in a broader pattern of similar-sized accumulation across the market. One wallet entry can be a test fill. A broader cluster of larger trades says more.
If you already use crypto volume analysis frameworks, the next step is to stop reading volume as a single line and start reading it as a stack of participants.
The real edge
The edge isn't in noticing that people traded. Everyone can see that.
The edge is in seeing that:
- Large trades are increasing while price is still flat
- Mid-sized participation is replacing earlier whale flow
- Small trades are exploding after a run, which often means late entrants are taking over
- Selling pressure is broad-based across buckets instead of isolated to one cohort
That's the kind of read that improves entries and exits.
A Chain Trade Size Chart gives structure to what good on-chain traders already do manually. It turns “this feels like smart money” into a repeatable visual process. And once you can chart that behavior, you can connect it to wallet-level execution instead of relying on vibes and screenshots.
Defining the Chain Trade Size Chart
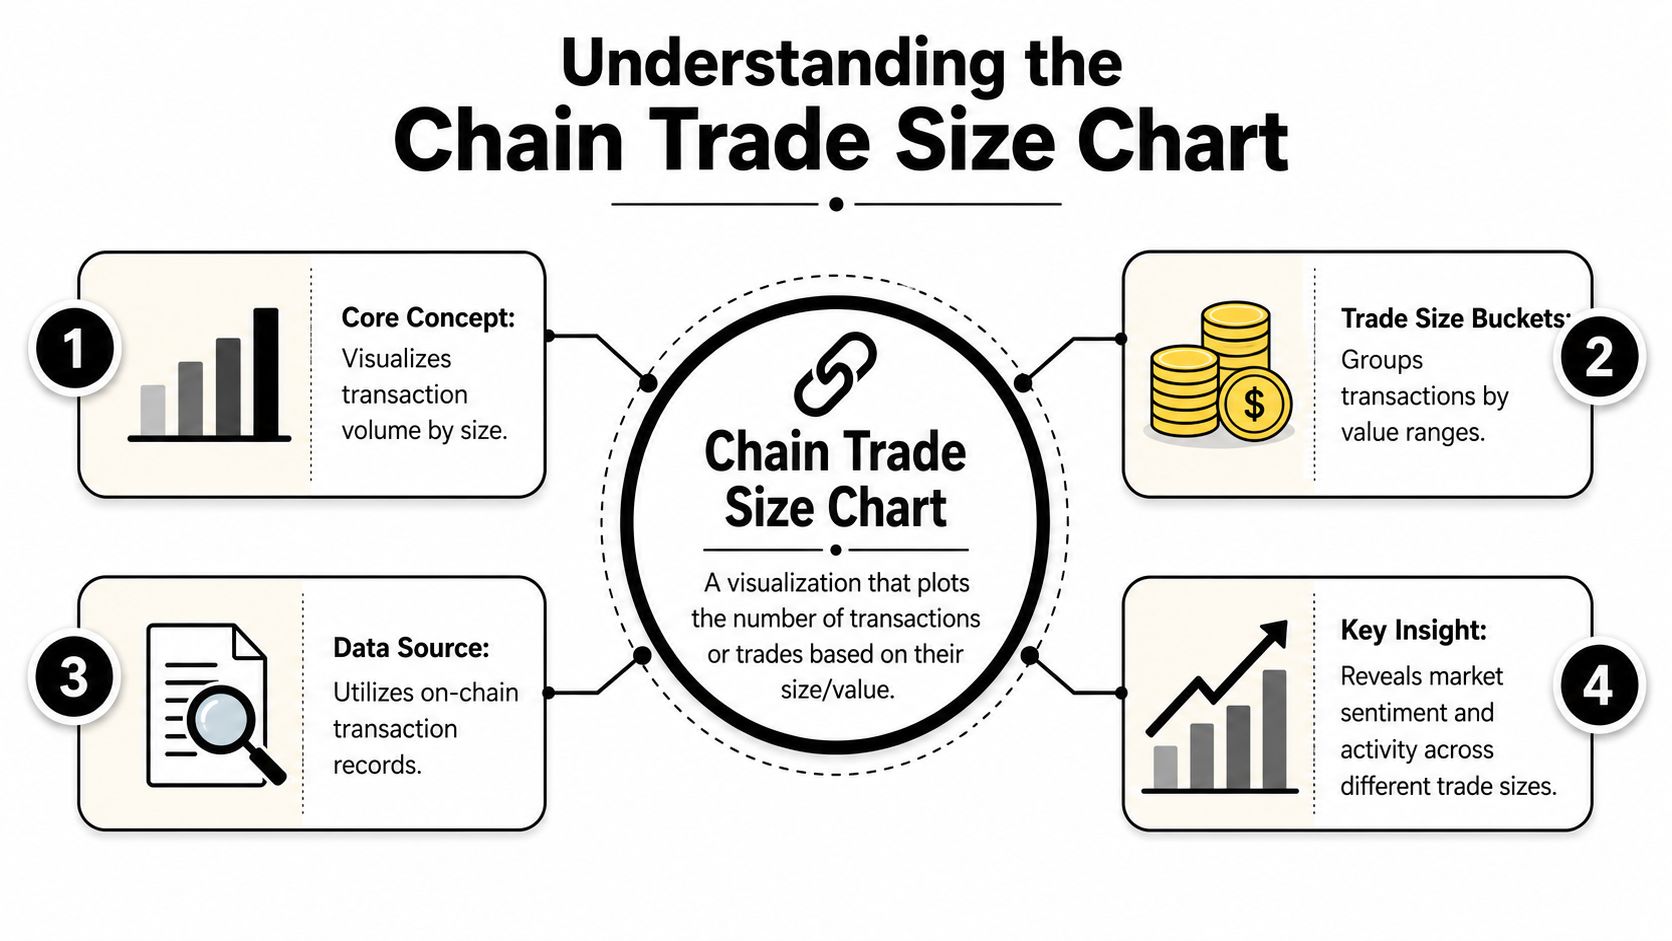
A Chain Trade Size Chart is a market participation chart. It groups trades into value ranges, then tracks those groups across time so you can see who's driving the tape.
That sounds simple, but it changes how you read a market.
A normal volume chart answers one question: how much traded? A Chain Trade Size Chart answers a better one: what mix of trade sizes created that activity? In crypto, that's often the difference between spotting deliberate accumulation and buying into a crowded reaction.
Start tracking smart money today
Join thousands of traders using WalletFinder.ai to find profitable wallets and copy their trades.
Start Free Trial →

