
Bullish Abandoned Baby: Candlestick Pattern Mastery
Master the powerful bullish abandoned baby pattern. Learn identification, backtested reliability, and trading rules with on-chain examples.
You know the setup. A token has been bleeding for days, sentiment is dead, the timeline is calling for lower prices, and then the market snaps higher without giving a clean second chance. Most missed reversals don’t happen because traders can’t see weakness in sellers. They happen because the entry trigger is fuzzy.
That’s where the bullish abandoned baby earns attention. It’s not common, and that’s part of the appeal. When it appears correctly, it shows a very specific shift in control. Sellers press price down, momentum stalls into a doji, then buyers gap price back up and take over.
Used alone, it’s still just a chart pattern. Used with structure, volume, and on-chain confirmation, it becomes a serious reversal framework for crypto traders who care about timing and conviction.
Spotting Reversals Before They Happen
Most traders recognize exhaustion only after price has already moved. The chart looks washed out, momentum feels weak, and support starts attracting bids, but none of that tells you exactly when to act.
The bullish abandoned baby does.
It’s one of the few reversal patterns that gives a clean visual handoff from sellers to buyers. That is important in crypto, where fake bounces are common and “bottom fishing” can turn into repeated losses if you enter too early.
Why this pattern matters
The strength of this setup comes from its structure, not from wishful interpretation.
You want to see three things at once:
- A real downtrend: The pattern has meaning only when sellers have already controlled price.
- A stalled move lower: The middle candle shows hesitation instead of continued collapse.
- An aggressive reclaim: Buyers don’t just stabilize price. They reject lower levels and push it back up fast.
That combination is what separates this from weaker bottoming patterns.
Practical rule: If the market is chopping sideways, skip it. The bullish abandoned baby is a reversal pattern, not a range pattern.
What traders usually get wrong
Most mistakes happen before the trade is even placed.
Common errors include:
- Forcing the label: Traders call any three-candle bounce a bullish abandoned baby.
- Ignoring context: A pattern in the middle of noise isn’t the same as one after real selling pressure.
- Buying too early: Entering before the third candle proves buyer control usually reduces the edge.
- Skipping confirmation: In crypto, a clean chart pattern is stronger when broader market conditions and flow support it.
The edge comes from being strict. If the structure is messy, it’s not the setup.
Anatomy of the Bullish Abandoned Baby
The bullish abandoned baby is a rare three-candlestick reversal pattern that forms at the end of a downtrend. It consists of a large red bearish candle, then a doji that gaps down, then a large green bullish candle that gaps up. The gaps around the doji are mandatory. Without them, the pattern is invalid and starts to look like a weaker formation instead, as described by The Trading Analyst’s bullish abandoned baby guide.
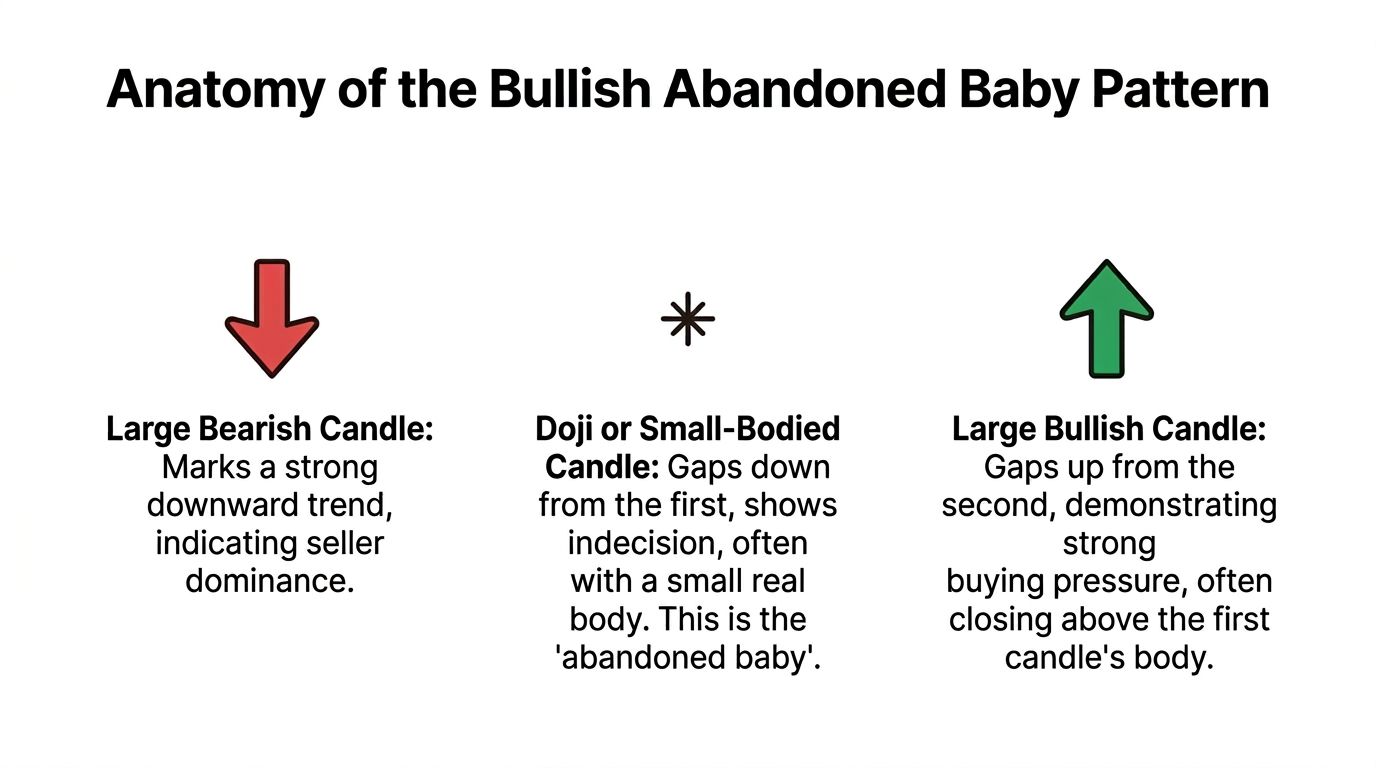
If you need a quick refresher on candle structure before applying this setup, this candlestick chart for cryptocurrency guide is a useful companion.
Candle one shows seller control
The first candle should be clearly bearish.
This isn’t a random red candle in a flat market. It should look like continuation, the kind of candle that makes late shorts feel comfortable and early buyers feel trapped.
What matters psychologically is simple. Sellers still believe they’re in control. The market agrees, at least for one more push lower.
Candle two is the abandoned baby
The second candle is the heart of the pattern.
It’s a doji, or at minimum a very small real body, and it must sit below the first candle with a gap. That isolation is what gives the pattern its name. Price has been pushed lower, but instead of extending the selloff with confidence, the market stalls.
That stall matters more than many traders think.
A doji at the bottom of a downtrend says neither side is pressing with conviction at those lower prices. Sellers no longer have the same urgency. Buyers haven’t fully taken over yet, but they’re no longer backing away.
The doji isn’t the reversal by itself. It’s the point where downside momentum stops behaving like strong momentum.
Candle three confirms buyer takeover
The third candle is where the signal becomes actionable.
It must gap up from the doji and print a strong bullish body. In a clean version of the pattern, that candle doesn’t just bounce. It reclaims territory with intent and closes deep enough into prior damage to show that buyers are now the side dictating price.
That upward gap is the tell.
In weaker reversal structures, buyers improve price gradually. In a bullish abandoned baby, they reject the lower area so aggressively that the market leaves another gap. That’s a much stronger statement.
Why the gaps matter so much
Many traders identify the color sequence correctly but miss a key requirement.
The pattern only deserves the name if the doji is flanked by gaps. Those gaps create a small “island” in price action. Visually, the market abandons the lower area and then abandons it again on the way back up.
That’s why the pattern carries more weight than a standard bullish engulfing or an ordinary three-candle recovery.
The easiest way to understand it is:
- First gap down: sellers force price into a lower zone
- Doji: that lower zone fails to attract continued pressure
- Second gap up: buyers reject that zone entirely
The market isn’t negotiating. It’s changing its mind fast.
A practical checklist for live charts
When scanning crypto charts, use a tight filter:
| Element | What you want to see | What weakens it |
|---|---|---|
| Prior trend | Clear downtrend with repeated lower movement | Sideways chop |
| First candle | Strong bearish body | Small mixed candle |
| Middle candle | Doji or tiny body, isolated | Overlap with nearby candles |
| Third candle | Strong bullish candle with clear reclaim | Weak green candle or hesitation |
| Gap structure | Visible gap below and above the doji | No real separation |
Start tracking smart money today
Join thousands of traders using WalletFinder.ai to find profitable wallets and copy their trades.
Start Free Trial →

