
Bitcoin Difficulty Chart Explained
Go beyond the surface of the Bitcoin difficulty chart. This guide explains how it works, what it signals, and how traders use it for on-chain analysis.
A bitcoin difficulty chart is more than just a line on a graph; it's a visual readout of the network's pulse. It shows you exactly how hard miners have to work to solve the computational puzzle that adds new blocks to the Bitcoin blockchain. Think of it as the network's built-in pacemaker, constantly adjusting to keep everything running smoothly and securely.
What The Bitcoin Difficulty Chart Actually Reveals
Imagine a global gold rush where, as more miners join the hunt, the gold magically becomes harder to find. That's a perfect way to understand Bitcoin's mining difficulty. This isn't just a random number—it's the network's immune system, a self-regulating mechanism that ensures new blocks are found roughly every 10 minutes, no matter how many miners are competing.
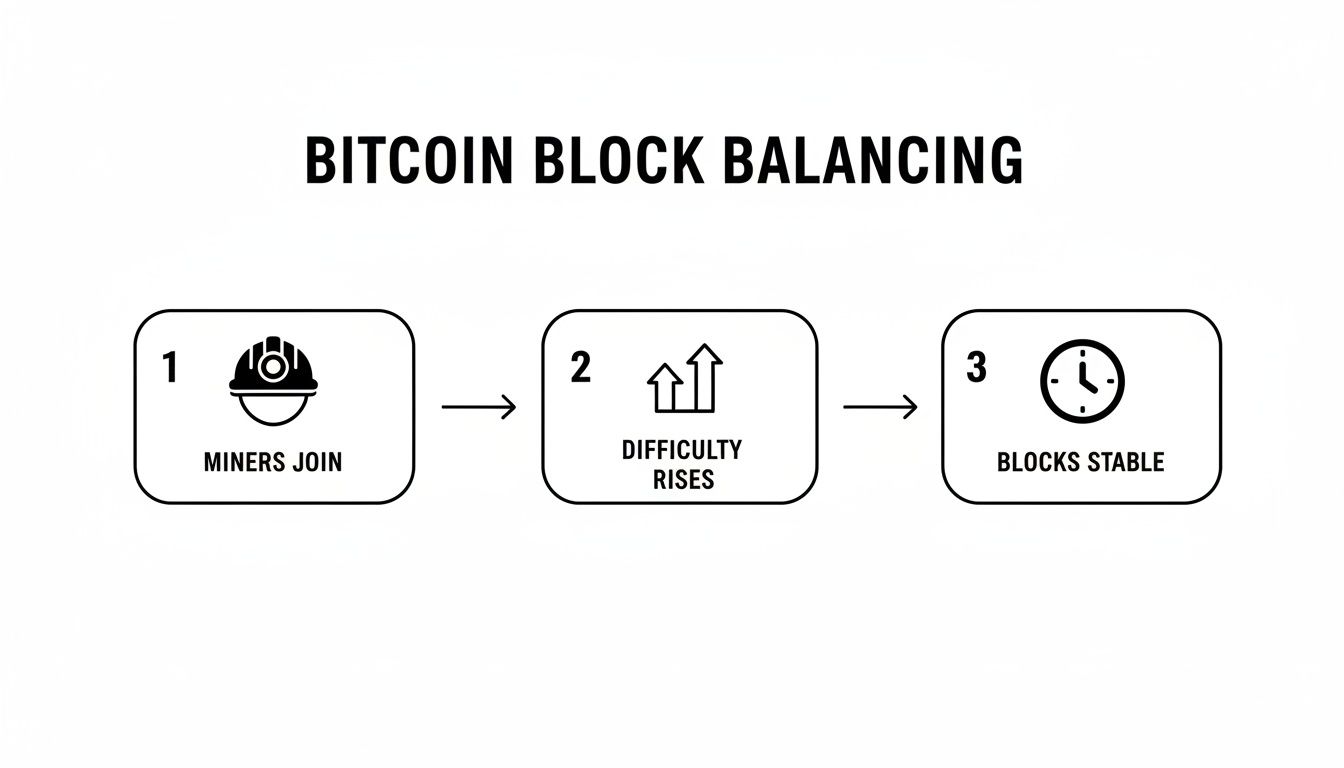
When more miners plug in powerful new hardware, the network's total computing power (or "hashrate") goes up. To keep the 10-minute block time stable, the difficulty automatically increases. On the flip side, if a large number of miners switch off their machines, the difficulty drops, making it easier for the remaining miners to find a block. This elegant balancing act is at the core of what makes Bitcoin so resilient.
The Story of Network Growth and Security
Looking at the bitcoin difficulty chart over time tells an incredible story of growth and security. In the very beginning, the challenge was trivial. The difficulty has exploded from just 1 when Satoshi Nakamoto mined the genesis block in January 2009—a level where a basic home computer could do the job—to a staggering 146.47 trillion as of block 932,898. This mind-blowing increase shows just how much the network has matured. You can explore this historical growth in detail on CoinWarz.
This exponential rise points to a massive influx of investment, hardware, and energy dedicated to securing the network. A higher difficulty means it takes an astronomical amount of computational power to try and attack the blockchain, making it one of the most secure computer networks ever created.
A rising difficulty is a direct measure of the network's health and the fierce competition among miners. It shows the network is valuable enough to attract immense resources, creating a robust and tamper-proof ledger.
For both miners and traders, this single metric is a powerhouse of information. It gives crucial context for:
- Miners: Figuring out potential profitability and knowing when it's time for a hardware upgrade.
- Traders: Spotting macro market signals that might indicate miner confidence or even upcoming market stress.
Here’s a snapshot of a live bitcoin difficulty chart, which visualizes this constant adjustment and long-term growth.
Notice the chart's distinct "stair-step" pattern? That’s the difficulty adjustment in action. It happens automatically every 2,016 blocks (roughly two weeks), clearly showing how the network responds to changes in mining power. Getting comfortable with this chart is the first step toward understanding Bitcoin's fundamental mechanics on a much deeper level.
Bitcoin Difficulty At A Glance
This table breaks down the core concepts of Bitcoin's mining difficulty for quick and easy understanding.
ConceptSimple ExplanationWhy It Matters for TradersDifficulty TargetAn internal network setting that determines how hard the mining puzzle is. A lower target means a higher difficulty.The target is what actually changes, affecting how much work is needed to mine. This has a direct impact on miner costs and potential selling pressure.Adjustment PeriodThe difficulty recalibrates every 2,016 blocks (about 2 weeks) to maintain a 10-minute average block time.These adjustments create predictable events. A large upcoming difficulty increase might signal strong miner confidence, while a big drop could suggest miners are capitulating.HashrateThe total combined computational power of all miners on the network.Hashrate is the input that drives difficulty changes. A rising hashrate (and thus difficulty) is often seen as a bullish, long-term sign of network health and security.
By grasping these three elements, you can start to see the difficulty chart not just as a historical record, but as a live indicator of the network's economic and security landscape.
How The Difficulty Adjustment Mechanism Works
At the very core of Bitcoin's design is a brilliant, self-regulating system: the difficulty adjustment. Think of it as the network's built-in thermostat. It works automatically to keep everything stable and predictable, no CEO or central bank required.
The network has one simple goal: to make sure a new block is found, on average, every 10 minutes. To hit this target, the protocol runs a check-up every 2,016 blocks. This works out to be almost exactly two weeks (14 days), since 10 minutes per block times 2,016 blocks is 20,160 minutes.
The Two-Week Recalibration Cycle
Every two weeks, the network essentially asks itself, "How did we do?" It measures the actual time it took to mine the last 2,016 blocks and compares that to the 20,160-minute target.
This simple check leads to one of two outcomes:
- Miners Were Too Fast: If a flood of new mining power (hashrate) caused the blocks to be found in less than two weeks, the difficulty goes up. The puzzle gets harder, slowing everyone down to get back to that 10-minute average.
- Miners Were Too Slow: On the flip side, if miners left the network and it took longer than two weeks to find the blocks, the difficulty goes down. The puzzle gets easier, helping the remaining miners speed up and hit the target.
This constant back-and-forth is what creates the iconic "stair-step" pattern you see on any bitcoin difficulty chart. Each step up or down is a new adjustment, a perfect visual of the network adapting in real-time. You can actually see this happening live using tools that let you watch block data. For a deeper dive, check out our guide on what a blockchain explorer is and how it works.
This flowchart breaks down the simple, self-governing loop that keeps Bitcoin's block production on a steady rhythm.
Start tracking smart money today
Join thousands of traders using WalletFinder.ai to find profitable wallets and copy their trades.
Start Free Trial →

