
The Basics of Technical Analysis: Crypto Guide 2026
Master the basics of technical analysis for crypto. This 2026 guide covers trends, indicators, chart patterns, and combining TA with on-chain data.
You open a crypto chart to check one setup, then five minutes later you're staring at candles, moving averages, volume bars, RSI, trend lines, and a dozen opinions from X. The screen looks busy, but your decision still feels fuzzy. Buy now, wait, or walk away?
That confusion is normal. Most new traders don't fail because charts are impossible to read. They struggle because nobody shows them how to separate signal from decoration.
From Chaos to Clarity Your Introduction to Technical Analysis
A chart can look random until you know what you're reading. Once you do, it stops being a pile of lines and starts acting like a record of crowd behavior. Buyers push, sellers defend, momentum builds, momentum fades. Technical analysis is how traders read that behavior from market history.
The roots of technical analysis are commonly traced to Charles Dow's work between 1851 and 1902, and Dow Theory still frames markets in three trend timeframes: primary movements lasting a year to several years, secondary reactions lasting 10 days to a year, and minor movements lasting seconds to days according to IG's overview of technical analysis and Dow Theory. That matters because the same logic still shows up on a crypto chart today. A token can be bullish on a higher timeframe, choppy on the daily, and messy on the intraday all at once.
For crypto traders, this point clears up one of the first major mistakes. You can be "right" about the bigger move and still lose money on the entry because you traded the wrong timeframe. A strong long-term trend doesn't protect a bad short-term entry.
What technical analysis is really doing
At its core, the basics of technical analysis aren't about predicting the future with certainty. They're about asking better questions:
- Where is price trending
- Where have buyers or sellers stepped in before
- Is this move backed by real participation
- Where does my trade idea stop making sense
That last question matters most.
Practical rule: A chart isn't there to prove you're right. It's there to show you when you're wrong.
In crypto, that mindset helps because price can move fast, liquidity can thin out quickly, and sentiment flips without warning. If you treat technical analysis like a crystal ball, you'll overtrade. If you treat it like a framework for making cleaner decisions, you'll survive long enough to improve.
A good trader doesn't try to know everything. A good trader learns to read structure, define risk, and wait for conditions that fit the plan.
Reading the Market The Pillars of Price Action
Technical analysis has a lot of tools, but most of them sit on top of three basics. If you can read trend, support and resistance, and volume, you can make sense of most charts before adding any indicator.
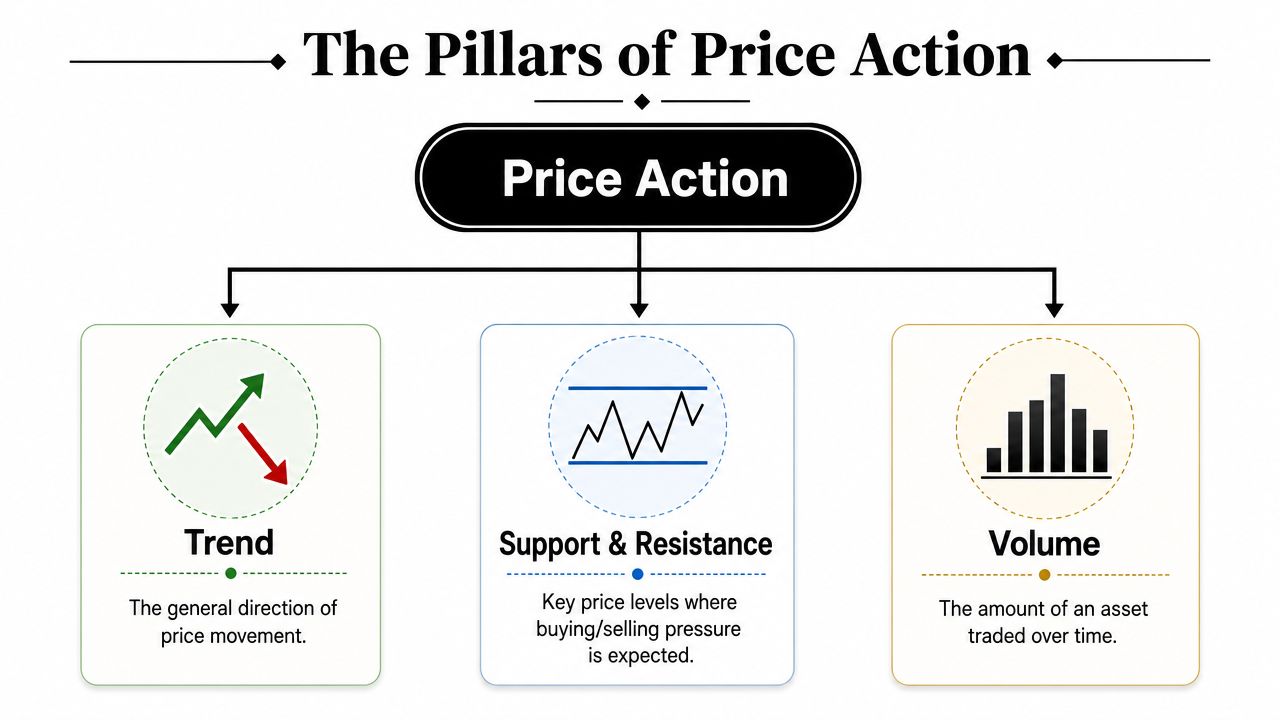
A technically rigorous baseline is that technical analysis treats price, volume, and open interest as the primary information set, and it assumes market prices already incorporate relevant information, as summarized in Wikipedia's technical analysis reference. In plain English, traders start with what the market is demonstrating, not what they wish it would do.
For a visual foundation, this guide on how to read crypto charts pairs well with the concepts below.
Trend is the market's path
Trend answers the simplest question first. Is price generally moving up, down, or sideways?
Think of trend like walking on a hillside. If the path keeps climbing, you're in an uptrend even if there are short slips along the way. If the path keeps dropping, sellers control the market. If the path goes nowhere, the market is ranging and often punishes impatient traders.
A quick working view:
| Market condition | What price often looks like | What traders usually do |
|---|---|---|
| Uptrend | Higher highs and higher lows | Look for pullbacks or continuation entries |
| Downtrend | Lower highs and lower lows | Stay defensive or look for rallies to fade |
| Range | Price bounces between clear levels | Trade edges carefully or wait for breakout confirmation |
Start tracking smart money today
Join thousands of traders using WalletFinder.ai to find profitable wallets and copy their trades.
Start Free Trial →

